
Descriptive statistics summarize the main characteristics of your sample and variables. Researchers usually present them before inferential tests such as a t test, ANOVA, correlation, or regression because they help readers understand the data before hypothesis testing begins.
When you report descriptive statistics in APA style, do not copy every value that SPSS produces. Instead, choose the statistics that best describe each variable and present them clearly using standard APA notation.
For example, you might describe a numerical variable as:
Participants had a mean age of 29.84 years (SD = 6.11).
For a categorical variable, you might write:
Women represented 60.0% of the sample (n = 72).
Approximately symmetric numerical data often call for the mean and standard deviation. Categorical variables usually require frequencies and percentages, while strongly skewed numerical data may call for the median and interquartile range.
This guide explains which descriptive statistics to report, how to format them in APA style, what you should italicize, how to convert SPSS output into clear results, and how to prepare APA-style tables and Results-section paragraphs.
If you have not calculated your statistics yet, start with our guide on How to Run Descriptive Statistics in SPSS.
Which Descriptive Statistics Should You Report?
Start by matching the statistic to the type of variable you want to describe.
For numerical data, also consider the shape of the distribution.
| Type of data | Descriptive statistics commonly reported |
|---|---|
| Approximately symmetric numerical data | Mean and standard deviation |
| Categorical data | Frequency and percentage |
| Strongly skewed numerical data | Median and interquartile range |
| Ordinal data | Frequencies, percentages, median, or IQR |
| Numerical data where observed limits matter | Minimum and maximum |
| Numerical data separated into groups | n, mean and SD or median and IQR for each group |
For example, age is numerical, so the mean and standard deviation can provide a useful summary.
Variables such as gender, employment status, study program, or treatment group are categorical. Frequencies and percentages usually describe them more appropriately.
Do not treat a variable as continuous simply because SPSS stores its categories as numbers. Suppose you code study status as:
1 = Full-time
2 = Part-time
Those numbers identify categories. A mean of the codes would not tell readers anything useful about study status.
Likert-type variables also require careful judgment. For a single Likert item ranging from Strongly disagree to Strongly agree, frequencies, percentages, or the median may provide useful summaries. Researchers often treat a composite score created from several Likert items differently, depending on the measurement approach and conventions within their field.
Always choose statistics according to what the variable represents, not simply according to what SPSS can calculate.
APA Rules for Reporting Descriptive Statistics
APA-style statistical reporting uses standard symbols to present results concisely.
You will commonly use the following notation when reporting descriptive statistics:
| Statistic | APA symbol | Example |
|---|---|---|
| Mean | M | M = 3.62 |
| Standard deviation | SD | SD = 0.74 |
| Total sample size | N | N = 120 |
| Subgroup sample size | n | n = 72 |
| Median | Mdn | Mdn = 12 |
| Interquartile range | IQR | IQR = 8–18 |
Leave a space on both sides of an equals sign.
Write:
M = 3.62
rather than:
M=3.62
Statistical notation should support your writing rather than make the Results section difficult to read.
For example:
Participants had a mean age of 29.84 years (SD = 6.11).
reads more naturally than:
Age was M = 29.84, SD = 6.11.
Both versions communicate the same values, but the first incorporates the statistics into a complete sentence.
How many decimal places should you use?
SPSS often displays more decimal places than your report needs.
For example, your output might show:
Mean = 3.618421
Standard deviation = 0.736184
You could report these values as:
M = 3.62, SD = 0.74
Two decimal places work well for many means and standard deviations. Depending on the context, you may report percentages with zero, one, or two decimal places.
Aim for meaningful precision rather than maximum precision.
Keep comparable statistics consistent. If you report one scale mean to two decimal places, use the same precision for the other scale means unless you have a good reason not to.
What Should Be Italicized in APA Statistical Reporting?
APA style italicizes many statistical symbols that use Latin letters.
For descriptive statistics, you will commonly italicize:
| Item | Italicize? | Correct example |
|---|---|---|
| Mean symbol, M | Yes | M = 3.62 |
| Standard deviation, SD | Yes | SD = 0.74 |
| Total sample size, N | Yes | N = 120 |
| Subgroup sample size, n | Yes | n = 72 |
| Median, Mdn | Yes | Mdn = 12 |
| Numbers | No | 3.62 |
| Equals sign | No | = |
| Percentage sign | No | 60.0% |
| Parentheses | No | (SD = 0.74) |
For example:
Participants reported moderate academic stress (M = 3.62, SD = 0.74).
In that sentence, italicize only M and SD.
Do not italicize the complete expression:
M = 3.62, SD = 0.74
That format incorrectly places the numbers, equals signs, and punctuation in italics.
The same rule applies to sample size:
Women represented 60.0% of the sample (n = 72).
Only n needs italics.
When you write the statistical term as an ordinary word, keep it in regular type.
For example:
The mean academic stress score was 3.62.
The word mean does not need italics because you have written the term rather than the statistical symbol M.
How to Report Common Descriptive Statistics in APA Style
Your sentence structure will depend on the statistic you need to report.
Mean and Standard Deviation
For many continuous or scale variables, report the mean together with the standard deviation.
A common format is:
Participants reported moderate academic stress (M = 3.62, SD = 0.74).
You can also incorporate the mean directly into the sentence:
Participants had a mean age of 29.84 years (SD = 6.11).
When you report several related variables, use a consistent structure:
The mean academic stress score was 3.62 (SD = 0.74), while the mean study satisfaction score was 4.08 (SD = 0.66).
You may also describe groups separately:
Full-time students had a mean academic stress score of 3.74 (SD = 0.69), compared with 3.42 (SD = 0.77) among part-time students.
This statement describes the pattern within your sample. It does not show that the difference is statistically significant.
Avoid writing:
Full-time students had significantly higher stress.
unless an appropriate inferential test supports that conclusion.
Frequencies and Percentages
Use frequencies and percentages to describe categorical variables.
Suppose your sample contains 120 students, including 72 women and 48 men.
You could write:
Women represented 60.0% of the sample (n = 72), while men represented 40.0% (n = 48).
Another option is:
Of the 120 participants, 72 were women (n = 72, 60.0%) and 48 were men (n = 48, 40.0%).
Combining the count and percentage helps readers understand both the number of cases and their proportion within the sample.
Check for missing responses before you copy percentages from SPSS. When the output includes both Percent and Valid Percent, inspect the number of missing cases and choose the percentage that accurately represents the analysis you want to report.
Median and Interquartile Range
The median can provide a better description of the center when numerical data have a strongly skewed distribution or contain influential extreme values.
For example:
Weekly study time had a median of 12 hours (Mdn = 12, IQR = 8–18).
The interquartile range summarizes the middle portion of the observations and reduces the influence of unusually high or low values.
Minimum and Maximum
Minimum and maximum values can help readers understand the observed limits of a numerical variable.
You might write:
Participants ranged in age from 21 to 54 years.
For a scale score:
Academic stress scores ranged from 1.60 to 5.00.
You do not need to report minimum and maximum values for every variable. Include them when they add useful information to the description of your data.
Descriptive Statistics APA Style Templates
The following APA descriptive statistics templates provide quick structures that you can adapt to your own results.
Replace the bracketed text with values from your analysis and make sure that statistical symbols such as M, SD, N, n, and Mdn appear in italics.
Mean and Standard Deviation Template
Participants had a mean [VARIABLE] score of [MEAN] (SD = [STANDARD DEVIATION]).
Example:
Participants had a mean academic stress score of 3.62 (SD = 0.74).
You can also use:
Participants reported [DESCRIPTION] [VARIABLE] (M = [MEAN], SD = [STANDARD DEVIATION]).
Example:
Participants reported moderate academic stress (M = 3.62, SD = 0.74).
Frequency and Percentage Template
[CATEGORY] represented [PERCENTAGE]% of the sample (n = [FREQUENCY]).
Example:
Women represented 60.0% of the sample (n = 72).
For two categories, use:
[CATEGORY 1] represented [PERCENTAGE 1]% of the sample (n = [FREQUENCY 1]), while [CATEGORY 2] represented [PERCENTAGE 2]% (n = [FREQUENCY 2]).
Example:
Women represented 60.0% of the sample (n = 72), while men represented 40.0% (n = 48).
Median and Interquartile Range Template
[VARIABLE] had a median of [MEDIAN] (Mdn = [MEDIAN], IQR = [LOWER VALUE]–[UPPER VALUE]).
Example:
Weekly study time had a median of 12 hours (Mdn = 12, IQR = 8–18).
Range Template
[VARIABLE] ranged from [MINIMUM] to [MAXIMUM].
Example:
Participants ranged in age from 21 to 54 years.
Two-Group Descriptive Comparison Template
[GROUP 1] had a mean [VARIABLE] score of [MEAN 1] (SD = [SD 1]), compared with [MEAN 2] (SD = [SD 2]) among [GROUP 2].
Example:
Full-time students had a mean academic stress score of 3.74 (SD = 0.69), compared with 3.42 (SD = 0.77) among part-time students.
Use this template only to describe the observed group values. You need an appropriate inferential test before you can make a claim about statistical significance.
Complete Descriptive Statistics Results Paragraph Template
Use the following structure when you need to describe your sample and several important variables:
The final sample consisted of [N] participants. Participants had a mean age of [MEAN AGE] years (SD = [AGE SD]), with ages ranging from [MINIMUM] to [MAXIMUM] years. [CATEGORY 1] represented [PERCENTAGE 1]% of the sample (n = [FREQUENCY 1]), while [CATEGORY 2] represented [PERCENTAGE 2]% (n = [FREQUENCY 2]). The mean [VARIABLE 1] score was [MEAN 1] (SD = [SD 1]), while the mean [VARIABLE 2] score was [MEAN 2] (SD = [SD 2]).
Replace each placeholder with the corresponding value from your analysis.
How to Turn SPSS Output Into APA Style
SPSS helps you calculate and inspect your statistics, but the software does not write your final Results section for you.
Suppose SPSS gives you the following values for academic stress:
| Statistic | Value |
|---|---|
| N | 120 |
| Mean | 3.6184 |
| Standard deviation | 0.7362 |
| Minimum | 1.60 |
| Maximum | 5.00 |
A concise APA-style result might read:
Participants reported a mean academic stress score of 3.62 (SD = 0.74).
If the observed limits matter, you could add:
Scores ranged from 1.60 to 5.00.
Notice how the final report differs from the original SPSS output. You have rounded the mean and standard deviation to sensible precision, selected the values that matter, and converted the results into readable prose.
Now suppose SPSS gives you this frequency table:
| Study status | Frequency | Valid Percent |
|---|---|---|
| Full-time | 78 | 65.0 |
| Part-time | 42 | 35.0 |
| Total | 120 | 100.0 |
You could write:
Most participants studied full time (n = 78, 65.0%), while 42 participants studied part time (n = 42, 35.0%).
Instead of asking how to copy SPSS output into your paper, ask which values your reader needs to understand the sample or variable.
If you still need to generate these statistics, follow our How to Run Descriptive Statistics in SPSS guide first.
How to Report Descriptive Statistics in an APA Results Section
Most researchers introduce descriptive statistics near the beginning of the Results section. This approach gives readers essential information about the sample and main variables before the report moves to inferential tests.
A logical sequence is:
- Overall sample size
- Important participant characteristics
- Descriptive statistics for the main study variables
- Inferential analyses
Suppose a researcher surveyed 120 graduate students and measured age, gender, study status, academic stress, and study satisfaction.
The researcher could write:
The final sample consisted of 120 graduate students. Participants had a mean age of 29.84 years (SD = 6.11), with ages ranging from 21 to 54 years. Women represented 60.0% of the sample (n = 72), while men represented 40.0% (n = 48). Most participants studied full time (n = 78, 65.0%). The mean academic stress score was 3.62 (SD = 0.74), while the mean study satisfaction score was 4.08 (SD = 0.66).
This paragraph gives the statistics enough context to make them meaningful.
If missing values reduce the number of observations available for an important variable, tell readers how many valid cases contributed to that result.
For example:
Academic stress scores were available for 117 of the 120 participants.
Keep the Results section focused on what the analysis found. Save broader explanations of why a pattern occurred for the Discussion section unless your institution requires a different structure.
How to Present Descriptive Statistics in an APA Table
A short paragraph often works well when you only need to report a few statistics. When you have several variables or groups, a table can communicate the information more efficiently.
Consider the following example:
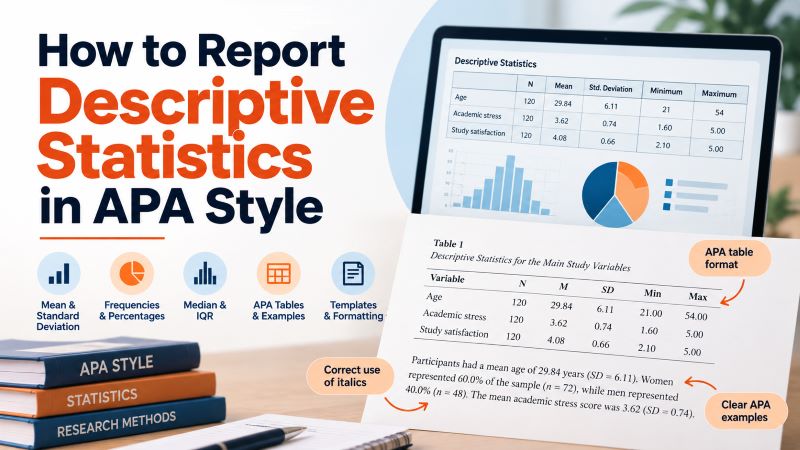
Table 1
Descriptive Statistics for the Main Study Variables
| Variable | N | M | SD | Min | Max |
|---|---|---|---|---|---|
| Age | 120 | 29.84 | 6.11 | 21.00 | 54.00 |
| Academic stress | 120 | 3.62 | 0.74 | 1.60 | 5.00 |
| Study satisfaction | 120 | 4.08 | 0.66 | 2.10 | 5.00 |
| Research self-efficacy | 120 | 3.79 | 0.71 | 1.80 | 5.00 |
Place the table number above the title. Use a concise title that tells readers what the table contains.
Keep statistical symbols such as N, M, and SD in italics and use consistent decimal precision for comparable variables.
In the surrounding text, focus on important findings instead of repeating the entire table.
For example:
Table 1 presents descriptive statistics for the main study variables. Participants reported a mean academic stress score of 3.62 (SD = 0.74) and a mean study satisfaction score of 4.08 (SD = 0.66).
You do not need to repeat every minimum, maximum, mean, and standard deviation after readers can already see them in the table.
A useful rule is:
Use the table for detail and the text for the information you want readers to notice.
Complete Descriptive Statistics APA Example
Consider a study that examines academic stress and study satisfaction among graduate students.
The sample contains 120 participants, and the analysis produces the following results:
| Variable | Result |
|---|---|
| Age | M = 29.84, SD = 6.11, range = 21–54 |
| Women | n = 72, 60.0% |
| Men | n = 48, 40.0% |
| Full-time students | n = 78, 65.0% |
| Part-time students | n = 42, 35.0% |
| Academic stress | M = 3.62, SD = 0.74 |
| Study satisfaction | M = 4.08, SD = 0.66 |
You could report these descriptive statistics as follows:
The study included 120 graduate students with a mean age of 29.84 years (SD = 6.11; range = 21–54). Women accounted for 60.0% of the sample (n = 72), while men accounted for 40.0% (n = 48). Most participants studied full time (n = 78, 65.0%), whereas 42 participants studied part time (n = 42, 35.0%). Participants reported a mean academic stress score of 3.62 (SD = 0.74) and a mean study satisfaction score of 4.08 (SD = 0.66).
Suppose you then summarize academic stress separately for full-time and part-time students:
| Study status | n | M | SD |
|---|---|---|---|
| Full-time | 78 | 3.74 | 0.69 |
| Part-time | 42 | 3.42 | 0.77 |
You could write:
Full-time students had a higher mean academic stress score (M = 3.74, SD = 0.69) than part-time students (M = 3.42, SD = 0.77).
This sentence describes what you observed in the sample.
It does not show whether the difference extends to the wider population. To answer that question, you would need an appropriate inferential test.
Common Mistakes When Reporting Descriptive Statistics
Many descriptive-statistics reporting problems come from including the wrong information or formatting correct information poorly.
Reporting a mean without variability.
Pair the mean with an appropriate measure of spread, such as the standard deviation, when the variable and analysis call for it.
Calculating means for category codes.
Numeric codes do not turn a categorical variable into a continuous one.
Copying SPSS tables directly into the paper.
Choose the relevant statistics and convert them into clear prose or an APA-style table.
Keeping too many decimal places.
Six decimal places rarely improve the usefulness of a descriptive result.
Reporting percentages without enough context.
Include the corresponding frequency when it helps readers understand the size of the category.
Confusing N and n.
Use N for the complete sample and n for a subgroup.
Italicizing the entire statistical expression.
Italicize the statistical symbols, not the numerical values or punctuation.
Repeating the whole table in your paragraph.
Highlight the most important findings instead.
Calling an observed difference significant.
Use the term statistically significant only when an appropriate inferential analysis supports the claim.
Reporting every statistic that SPSS generates.
Choose statistics because they help answer the research question or describe the sample, not because the software displayed them.
Descriptive Statistics APA Reporting Checklist
Before you finalize your Results section, confirm that:
- The descriptive statistic matches the type of variable.
- Means include an appropriate measure of variability.
- Categorical variables use frequencies and percentages where appropriate.
- Sample sizes appear clearly.
- M, SD, N, n, and Mdn use the correct italics.
- Numerical values and punctuation remain in regular type.
- Comparable statistics use sensible and consistent decimal places.
- Your writing translates SPSS output into clear academic reporting.
- Tables and surrounding paragraphs complement rather than duplicate each other.
- You do not describe sample differences as statistically significant without inferential evidence.
Need Help Reporting Your SPSS Results?
Generating statistics in SPSS is only one part of the analysis. You also need to decide which results matter, what they mean, and how to present them correctly.
If you are working on an assignment, dissertation, thesis, or research project, you can work one-to-one with a tutor through spss-tutors.com.
Your tutor can help you understand your own SPSS output, choose the appropriate statistics, and learn how to present the results clearly in APA style.
Frequently Asked Questions
How do you report mean and standard deviation in APA style?
A common format is:
Participants reported moderate academic stress (M = 3.62, SD = 0.74).
Use M for the mean and SD for the standard deviation.
What should be italicized when reporting descriptive statistics in APA?
Italicize statistical symbols such as M, SD, N, n, and Mdn.
Keep numerical values, equals signs, commas, percentage symbols, and parentheses in regular type.
For example:
M = 3.62, SD = 0.74
Do you italicize numbers in APA statistical reporting?
No. Italicize the statistical symbol, not the numerical value.
For example:
M = 3.62
The value 3.62 and the equals sign remain in regular type.
How many decimal places should descriptive statistics have?
Two decimal places work well for many means and standard deviations, although the appropriate precision depends on the variable and measurement scale.
Use enough precision to communicate the result accurately, and keep comparable statistics consistent.
What is the difference between N and n in APA style?
Use uppercase N for the total sample size and lowercase n for the number of observations in a subgroup.
For example:
The study included N = 120 students, including n = 72 women.
How do you report percentages in APA style?
You can combine the percentage with the corresponding frequency:
Women represented 60.0% of the sample (n = 72).
This format gives readers both the relative proportion and the number of observations.
When should you report the median instead of the mean?
Consider the median when numerical data show substantial skewness or when extreme observations strongly influence the mean.
Pair the median with an appropriate measure of spread, such as the interquartile range, when useful.
Should descriptive statistics appear in a table or in the text?
Use text when you only need to report a few important statistics. Use a table when you need to summarize several variables or groups.
Do not repeat every table value in the accompanying paragraph.
Can I copy an SPSS Descriptives table directly into my paper?
Usually, you should not.
SPSS designs its output primarily for analysis. Select the statistics that your readers need and present them as clear APA-style prose or in an appropriately formatted table.
If you still need to calculate your statistics, see our How to Run Descriptive Statistics in SPSS guide first.