
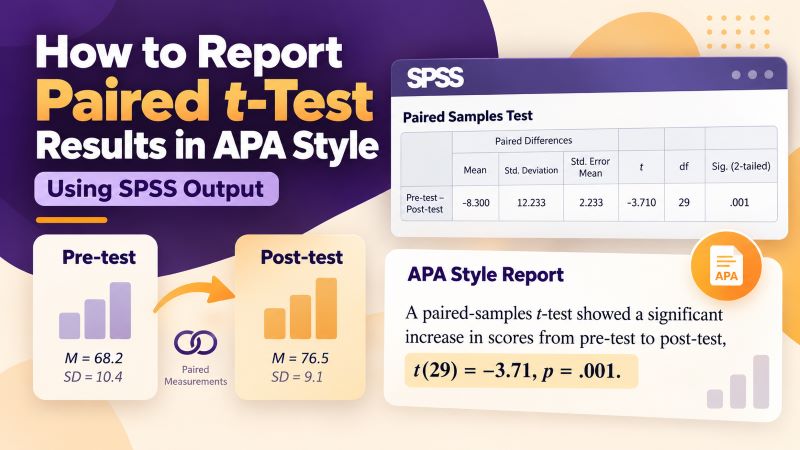
A paired t-test is commonly used when the same participants are measured twice, such as before and after an intervention, or when two related measurements are compared. Once you have run the test in SPSS, the next step is to turn the output into a clear APA-style result.
In this guide, you will learn how to report paired t-test results in APA, including which values to take from the SPSS output, where to find them, how to format them in APA style, and how to explain whether the paired measurements differed significantly. We will also cover the means and standard deviations, t-statistic, degrees of freedom, p-value, confidence interval, effect size, significant and nonsignificant results, and the effect of variable order on the sign of the mean difference.
If you have not run the analysis yet, start with our How to Run a Paired t-Test in SPSS guide.
What Should You Report for a Paired t-Test?
A complete paired t-test result will usually include:
- what paired measurements you compared;
- the mean (M) for each measurement;
- the standard deviation (SD) for each measurement;
- the t statistic;
- degrees of freedom;
- the p value;
- the direction of the difference;
- the 95% confidence interval for the mean difference when useful;
- an effect size such as Cohen’s d when required or appropriate.
For a short university assignment, your instructor may only expect:
M, SD, t, df, and p.
A dissertation, thesis, research report, or journal-style assignment may also expect a confidence interval and effect size.
The most important point is that the statistics should support a clear statement about what happened between the two related measurements.
Paired t-Test Results – APA Reporting Template
For a statistically significant result, you can adapt this template:
A paired-samples t test was conducted to compare [OUTCOME] between [CONDITION/TIME 1] and [CONDITION/TIME 2]. [CONDITION 2] scores (M = [MEAN 2], SD = [SD 2]) were significantly [higher/lower] than [CONDITION 1] scores (M = [MEAN 1], SD = [SD 1]), t([DF]) = [T VALUE], p = [P VALUE], 95% CI [[LOWER], [UPPER]], d = [EFFECT SIZE].
For our example:
A paired-samples t test was conducted to compare test scores before and after the study-skills program. Post-test scores (M = 66.90, SD = 7.50) were significantly higher than pre-test scores (M = 62.30, SD = 8.10), t(29) = −3.71, p = .001, 95% CI [−7.14, −2.06], d = 0.68.
If you do not need the confidence interval or effect size, use a shorter version:
A paired-samples t test was conducted to compare [OUTCOME] between [TIME 1] and [TIME 2]. [TIME 2] scores (M = [MEAN 2], SD = [SD 2]) were significantly [higher/lower] than [TIME 1] scores (M = [MEAN 1], SD = [SD 1]), t([DF]) = [T VALUE], p = [P VALUE].
For a nonsignificant result:
A paired-samples t test was conducted to compare [OUTCOME] between [TIME 1] and [TIME 2]. [TIME 1] scores (M = [MEAN 1], SD = [SD 1]) did not differ significantly from [TIME 2] scores (M = [MEAN 2], SD = [SD 2]), t([DF]) = [T VALUE], p = [P VALUE].
SPSS Output Used in This Guide
We will use the same example from our SPSS paired t-test tutorial.
A researcher measured the test scores of 30 students before and after a study-skills program.
SPSS produced the following descriptive statistics:
| Measurement | N | M | SD |
|---|---|---|---|
| Pre-test | 30 | 62.30 | 8.10 |
| Post-test | 30 | 66.90 | 7.50 |
The Paired Samples Test table produced:
| Statistic | Result |
|---|---|
| Mean difference, Pre − Post | −4.60 |
| t | −3.71 |
| df | 29 |
| Two-sided p | .001 |
| 95% CI of the difference | [−7.14, −2.06] |
The post-test mean is 4.60 points higher than the pre-test mean.
Because the variables were entered in SPSS as:
Pre_Test − Post_Test
SPSS reports the difference as:
−4.60
That variable order also explains why the t statistic is negative.
Step 1: State What Analysis You Conducted
Begin the result by telling the reader what you did.
For example:
A paired-samples t test was conducted to compare test scores before and after the study-skills program.
This sentence immediately gives the analysis context.
Avoid starting the paragraph with:
t(29) = −3.71, p = .001.
Those numbers have little meaning until the reader knows what you compared.
You can also connect the test to the research question:
A paired-samples t test was conducted to determine whether students’ test scores changed after completing the study-skills program.
Either approach works well.
Step 2: Report the Means and Standard Deviations
The descriptive statistics come from the Paired Samples Statistics table in SPSS.
For our example:
Pre-test
M = 62.30, SD = 8.10
Post-test
M = 66.90, SD = 7.50
You could write:
Students had a mean pre-test score of 62.30 (SD = 8.10) and a mean post-test score of 66.90 (SD = 7.50).
A more concise version is:
Post-test scores (M = 66.90, SD = 7.50) were higher than pre-test scores (M = 62.30, SD = 8.10).
The second version makes the direction of the change immediately clear.
Always report both the mean and standard deviation when describing the two measurements.
The means tell the reader which condition was higher, while the standard deviations show the variability in each set of scores.
Do You Report the Paired Samples Correlation?
SPSS normally produces a Paired Samples Correlations table.
Suppose it reports:
r = .62, p < .001
This statistic tells you that participants with relatively high pre-test scores also tended to have relatively high post-test scores.
It does not tell you whether the mean scores changed significantly.
You normally do not need the paired correlation in a standard paired t-test APA report unless:
- the correlation is relevant to your research question;
- your instructor asks for it;
- you need it for another calculation;
- the relationship between the paired scores is substantively important.
Do not use the p value from the Paired Samples Correlations table as the p value for the t-test.
For the actual hypothesis test, use the Paired Samples Test table.
Step 3: Report the t Statistic and Degrees of Freedom
Move to the Paired Samples Test table.
For our example:
t = −3.71
and:
df = 29
APA style combines these values as:
t(29) = −3.71
The degrees of freedom appear inside parentheses immediately after t.
Do not write:
t = −3.71, df = 29
when you can use the standard APA format.
For a paired t-test:
df = number of complete pairs − 1
Our analysis included 30 complete pairs:
30 − 1 = 29
This means you report:
t(29) = −3.71
If missing data reduce the number of complete pairs, use the degrees of freedom shown in the actual SPSS output rather than calculating it from the total number of rows in your dataset.
Step 4: Report the p Value
Our SPSS output gives:
p = .001
The result is statistically significant at the conventional α = .05 level because:
.001 < .05
APA style reports the result as:
p = .001
Notice that there is no leading zero.
Write:
p = .001
not:
p = 0.001
If SPSS displays:
.032
report:
p = .032
If SPSS displays:
.000
do not report:
p = .000
Instead, report:
p < .001
SPSS displays .000 because it rounds very small p values to three decimal places. The true probability is not exactly zero.
Which p Value Should You Use in SPSS?
Recent SPSS output may provide separate values for:
One-Sided p
and:
Two-Sided p
Use the value that matches the hypothesis you specified before analyzing the data.
For a research question such as:
Do students’ scores differ before and after the program?
the alternative hypothesis allows the scores to move in either direction.
Use the two-sided p value.
A directional hypothesis might state:
Students will score higher after the study-skills program.
A one-sided test may be appropriate when you clearly specified and justified that direction before examining the results.
Do not choose the one-sided p value after seeing the output because it produces a smaller number.
Older SPSS versions may label the two-sided p value:
Sig. (2-tailed)
Step 5: State the Direction of the Difference
A strong paired t-test result should tell the reader whether scores increased or decreased.
Our sample means are:
Pre-test: M = 62.30
Post-test: M = 66.90
The post-test mean is higher.
You can therefore write:
Post-test scores were significantly higher than pre-test scores.
This is clearer than simply writing:
There was a significant difference between pre-test and post-test scores.
Both statements are statistically correct, but the first tells readers what changed.
Always use the descriptive statistics to establish the direction.
Do not rely on the sign of the t statistic alone.
Why Is the t Statistic Negative When Scores Increased?
This often confuses students.
In our SPSS analysis, we entered:
Pre_Test first
and:
Post_Test second
SPSS therefore calculated:
Pre_Test − Post_Test
Using our means:
62.30 − 66.90 = −4.60
The mean difference is negative because post-test scores are higher.
The t statistic therefore also appears as a negative value:
t(29) = −3.71
This does not contradict the improvement.
It simply reflects the direction in which SPSS performed the subtraction.
If you entered Post_Test first and Pre_Test second, the mean difference and t statistic would become positive.
The two-sided p value and conclusion would remain the same.
For transparency, I recommend keeping the sign shown in the SPSS output rather than changing it without explanation.
Step 6: Report the Confidence Interval
SPSS provides a confidence interval for the mean paired difference.
For our example:
95% CI [−7.14, −2.06]
You can add it directly after the p value:
t(29) = −3.71, p = .001, 95% CI [−7.14, −2.06].
The interval refers to:
Pre_Test − Post_Test
because that is the pair order used in SPSS.
The negative limits therefore indicate that the pre-test mean is lower than the post-test mean.
If you want to explain the difference in the more intuitive post-minus-pre direction, you can say:
Post-test scores were 4.60 points higher on average than pre-test scores.
Be careful not to report the SPSS interval as if it were a confidence interval around either individual mean.
It is a confidence interval for the mean difference between the paired scores.
The interval also does not contain zero, which agrees with the statistically significant two-sided result.
Step 7: Report the Effect Size
An effect size tells the reader how large the standardized difference is.
If you requested effect sizes in SPSS, use the Paired Samples Effect Sizes output.
For example, suppose your selected Cohen’s d estimate has a magnitude of:
d = 0.68
You could report:
The difference represented a moderate-to-large effect, Cohen’s d = 0.68.
Or include it with the main statistical result:
Post-test scores (M = 66.90, SD = 7.50) were significantly higher than pre-test scores (M = 62.30, SD = 8.10), t(29) = −3.71, p = .001, d = 0.68.
Common reference values for Cohen’s d are:
| Cohen’s d | Common description |
|---|---|
| 0.20 | Small |
| 0.50 | Medium |
| 0.80 | Large |
Treat these values as general reference points rather than strict boundaries.
For paired measurements, several versions of Cohen’s d exist because different standardizers can be used. If SPSS produced the effect size, report the estimate associated with the method you selected and use that method consistently throughout the study.
Complete APA Paired t-Test Results Example
Using all of the main statistics from our SPSS output, a complete Results paragraph could read:
A paired-samples t test was conducted to determine whether students’ test scores changed after completing the study-skills program. Post-test scores (M = 66.90, SD = 7.50) were higher than pre-test scores (M = 62.30, SD = 8.10). This increase was statistically significant, t(29) = −3.71, p = .001, 95% CI [−7.14, −2.06]. The standardized difference was moderate to large, Cohen’s d = 0.68.
This paragraph gives the reader a clear sequence:
what was done → descriptive statistics → significance test → confidence interval → effect size
For a shorter assignment, you could write:
A paired-samples t test was conducted to compare pre-test and post-test scores. Post-test scores (M = 66.90, SD = 7.50) were significantly higher than pre-test scores (M = 62.30, SD = 8.10), t(29) = −3.71, p = .001.
Both versions clearly answer the research question.
How to Report Nonsignificant Paired t-Test Results in APA
A nonsignificant result still needs to be reported clearly.
Suppose SPSS produces:
Pre-test: M = 62.30, SD = 8.10
Post-test: M = 63.10, SD = 7.90
t(29) = −0.74
p = .465
You could write:
A paired-samples t test was conducted to compare test scores before and after the program. Pre-test scores (M = 62.30, SD = 8.10) did not differ significantly from post-test scores (M = 63.10, SD = 7.90), t(29) = −0.74, p = .465.
Do not write:
There was no difference between the scores.
The sample means differ numerically.
The test tells you that the available evidence was not sufficient to establish a population mean difference at the chosen significance level.
Avoid writing:
The null hypothesis was proven.
A nonsignificant test does not prove that the population mean difference equals exactly zero.
How to Report a Significant Decrease
The same reporting structure applies when scores decrease.
Suppose:
Pre-test: M = 72.60, SD = 8.40
Post-test: M = 67.20, SD = 7.90
t(29) = 4.18
p < .001
You could write:
A paired-samples t test was conducted to compare scores before and after the intervention. Post-test scores (M = 67.20, SD = 7.90) were significantly lower than pre-test scores (M = 72.60, SD = 8.40), t(29) = 4.18, p < .001.
The wording follows the actual direction of the means.
What Should Be Italicized in APA Style?
APA statistical notation italicizes several Latin statistical symbols.
For a paired t-test report, italicize:
- M
- SD
- t
- p
- N or n
- d
For example:
Post-test scores (M = 66.90, SD = 7.50) were significantly higher than pre-test scores (M = 62.30, SD = 8.10), t(29) = −3.71, p = .001, d = 0.68.
Do not italicize:
- numerical values;
- equals signs;
- parentheses;
- commas;
- confidence interval brackets;
- the abbreviation CI.
Only the statistical symbols require italics.
How Many Decimal Places Should You Report?
Consistency matters more than copying every decimal place from SPSS.
A practical approach is:
- means: usually two decimal places;
- standard deviations: usually two decimal places;
- t: usually two decimal places;
- p: usually three decimal places when reporting an exact value;
- effect size: usually two decimal places.
For example, SPSS may display:
t = −3.709
You can report:
t(29) = −3.71
If SPSS reports:
p = .001
keep:
p = .001
Do not add unnecessary precision simply because the software displays it.
Do You Need an APA Table?
For one paired t-test, a table is often unnecessary.
A well-written sentence or short paragraph can communicate the complete result.
A table becomes more useful when you have:
- several paired outcomes;
- several pre-test/post-test measures;
- multiple time points summarized across several tests;
- a dissertation with many related analyses.
For example:
Table 1
Paired-Samples t-Test Results for Pre-Test and Post-Test Scores
| Measure | Pre-Test M (SD) | Post-Test M (SD) | Mean Difference | t(df) | p | 95% CI |
|---|---|---|---|---|---|---|
| Test score | 62.30 (8.10) | 66.90 (7.50) | −4.60 | −3.71 (29) | .001 | [−7.14, −2.06] |
You could introduce the table with:
A paired-samples t test was conducted to examine changes in test scores following the program. As shown in Table 1, post-test scores were significantly higher than pre-test scores.
Do not repeat every statistic from the table in the paragraph.
Use the table for detail and the text to highlight the result that matters.
Do You Need to Report the Mean Difference?
You do not always need to report the mean difference separately when you already provide both means.
However, it can make the result easier to understand.
For our example:
Post-test scores increased by an average of 4.60 points.
This statement communicates the change in the original measurement units.
If you also report the SPSS confidence interval, remember that its sign follows the order used in the analysis.
Since SPSS calculated:
Pre_Test − Post_Test
it reports:
Mean difference = −4.60
You can describe the same result in plain language as:
Scores increased by 4.60 points from pre-test to post-test.
There is no contradiction between the two statements.
Should You Say the Intervention Caused the Change?
Be careful with causal wording.
A significant paired t-test tells you that the mean measurements differ.
Whether you can conclude that an intervention caused the difference depends on the study design.
For a simple before-and-after observational design, write:
Scores were significantly higher after the program.
Avoid automatically writing:
The program caused scores to improve.
Other factors may explain some or all of the observed change.
If your study uses a design that supports stronger causal inference, your interpretation can reflect that design.
Common Mistakes When Reporting a Paired t-Test
- Reporting statistics before explaining what was tested. Start by telling the reader that you conducted a paired-samples t test and what measurements you compared.
- Leaving out the means and standard deviations. The descriptive statistics show the direction and context of the result.
- Using the p value from the Paired Samples Correlations table. Use the p value from the Paired Samples Test table for the hypothesis test.
- Writing p = .000. Report very small values as p < .001.
- Adding a leading zero to p. Write p = .032 rather than p = 0.032.
- Reporting only that the result was significant. Tell the reader whether scores increased or decreased.
- Assuming a negative t statistic means scores decreased. The sign depends on the order in which SPSS subtracts the paired variables.
- Changing the sign of t without understanding why. Keeping the SPSS sign avoids confusion and preserves the direction of the analyzed difference.
- Misinterpreting the confidence interval.
The interval in the Paired Samples Test table refers to the mean paired difference. - Claiming a nonsignificant result proves equality.
A nonsignificant result means the analysis did not provide sufficient evidence of a population mean difference. - Claiming the paired t-test alone proves causation.
Causal conclusions depend on the research design. - Copying SPSS output into the Results section.
Extract the relevant statistics and present them in clear APA-style prose or an appropriate table.
Paired t-Test APA Reporting Checklist
Before finalizing your Results section, check that:
- you stated that a paired-samples t test was conducted;
- you explained what two measurements were compared;
- you reported the mean for both measurements;
- you reported the standard deviation for both measurements;
- you reported t with the degrees of freedom in parentheses;
- you used the correct p value from the Paired Samples Test table;
- you reported p < .001 rather than p = .000 where necessary;
- you explained whether scores increased or decreased;
- you understood how SPSS variable order affected the sign of the difference;
- you reported the confidence interval correctly if included;
- you made clear that the confidence interval refers to the paired mean difference;
- you included an effect size when required or useful;
- you italicized APA statistical symbols correctly;
- you avoided unnecessary repetition between your table and text;
- your conclusion matches the research design.
Need Help Reporting Your Paired t-Test Results?
If you have already run the paired t-test but are unsure which SPSS values belong in your Results section, one-to-one tutoring can help you work through the output.
SPSS-tutors.com provides private tutoring for university students working with t tests, SPSS output interpretation, statistical assumptions, effect sizes, and APA reporting.
If you still need to conduct the analysis, start with our How to Run a Paired t-Test in SPSS guide.
Students using paired t-tests as part of a larger research project can also learn more about our SPSS Dissertation Help through one-to-one tutoring.
Frequently Asked Questions
How do you report a paired t-test in APA style?
Start by stating what analysis you conducted and what two measurements you compared.
For example:
A paired-samples t test was conducted to compare test scores before and after the program. Post-test scores (M = 66.90, SD = 7.50) were significantly higher than pre-test scores (M = 62.30, SD = 8.10), t(29) = −3.71, p = .001.
What values do I need from SPSS?
- Use the Paired Samples Statistics table for the means and standard deviations.
- Use the Paired Samples Test table for the mean difference, confidence interval, t statistic, degrees of freedom, and p value.
- Use the effect-size table if you requested an effect-size estimate.
Do I report the Paired Samples Correlations table?
Usually, no.
That table describes the relationship between the two sets of scores. It does not test whether their means differ.
Report it only when the correlation is relevant to your research question or reporting requirements.
How do I report t and degrees of freedom?
Use:
t(df) = value
For example:
t(29) = −3.71
Should I report the negative t value?
You can retain the sign shown in SPSS.
A negative value often reflects the order in which SPSS subtracts the paired measurements. Explain the direction of the actual change using the means.
Why is my t value negative when the post-test mean is higher?
SPSS subtracts Variable 2 from Variable 1.
If you entered Pre_Test first and Post_Test second, SPSS calculated:
Pre_Test − Post_Test
Higher post-test scores therefore produce a negative mean difference and negative t statistic.
How do I report p = .000 from SPSS?
Do not report:
p = .000
Report:
p < .001
Do I need to report the confidence interval?
Including the confidence interval provides useful information about the estimated mean difference and is often valuable in dissertations and research reports.
If you include it, use the confidence interval from the Paired Samples Test table.
What does the SPSS confidence interval refer to?
It refers to the mean difference between the two paired measurements.
The sign and direction depend on the order of the variables in SPSS.
Do I need to report Cohen’s d?
Effect size is often recommended because it describes the magnitude of the standardized change.
Whether it is required depends on your course, dissertation guidelines, journal, or supervisor.
What should be italicized?
Italicize statistical symbols such as M, SD, t, p, N, n, and d.
Do not italicize the numerical values, equals signs, parentheses, or confidence interval brackets.
How do I report a nonsignificant paired t-test?
State that the two measurements did not differ significantly.
For example:
Pre-test scores (M = 62.30, SD = 8.10) did not differ significantly from post-test scores (M = 63.10, SD = 7.90), t(29) = −0.74, p = .465.
Do not state that the two population means were proven to be equal.
Where can I learn how to run the paired t-test in SPSS?
See our step-by-step How to Run a Paired t-Test in SPSS guide for the data setup, assumptions, SPSS procedure, and output interpretation.