
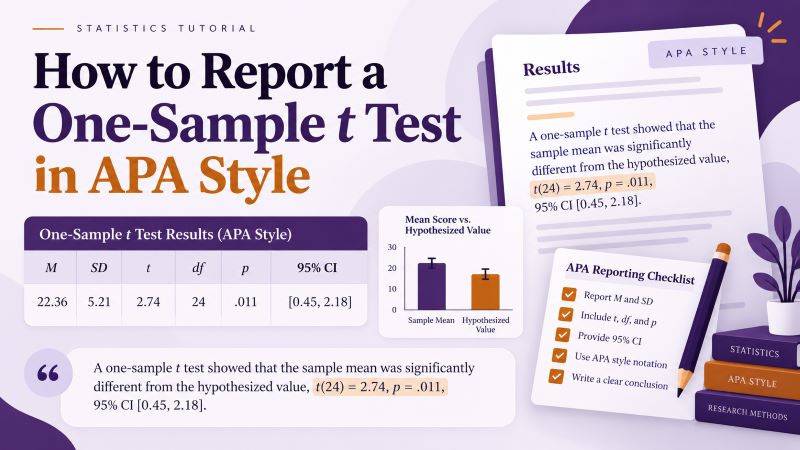
Reporting a one-sample t test in APA style is straightforward once you know which values to take from your SPSS output.
A complete result usually identifies the sample mean, standard deviation, test value, t statistic, degrees of freedom, p value, and direction of the difference. You can also report the confidence interval and an effect size such as Cohen’s d when they add useful information.
For example:
Students had a mean examination score of 78.40 (SD = 6.20), which was significantly higher than the benchmark of 75, t(24) = 2.74, p = .011, 95% CI [0.84, 5.96], d = 0.55.
This sentence tells the reader what you measured, what value you used for comparison, whether the difference was statistically significant, and how large the observed difference was.
This guide explains how to report one-sample t-test results in APA style using SPSS output. It also provides reporting templates, significant and nonsignificant examples, formatting rules, and a complete APA Results-section example.
If you still need to perform the analysis, start with our How to Run a One-Sample t Test in SPSS guide.
What Should You Include When Reporting a One-Sample t Test?
A strong one-sample t test report gives the reader enough information to understand both the statistical result and its meaning.
You will usually need the following values:
| Statistic | What it tells the reader |
|---|---|
| Sample mean, M | The average score in your sample |
| Standard deviation, SD | The spread of the sample scores |
| Test value | The benchmark used for comparison |
| t statistic | The standardized difference between the sample mean and test value |
| Degrees of freedom | The value reported inside parentheses after t |
| p value | Whether the observed difference reaches the chosen significance level |
| Mean difference | How far the sample mean lies above or below the test value |
| 95% confidence interval | The range of plausible values for the mean difference |
| Cohen’s d | The standardized size of the difference |
You do not always need to place every statistic in one sentence. However, your report should give enough information for readers to understand the direction, statistical evidence, and size of the observed difference.
For a short assignment, your lecturer may only expect the mean, standard deviation, t, degrees of freedom, and p value.
A thesis, dissertation, or journal-style report may also include the confidence interval and effect size.
One-Sample t Test APA Style Template
If your result is statistically significant, you can adapt the following template:
A one-sample t test showed that [VARIABLE] (M = [MEAN], SD = [STANDARD DEVIATION]) was significantly [higher/lower] than the [DESCRIPTION OF BENCHMARK] of [TEST VALUE], t([DF]) = [T VALUE], p = [P VALUE], 95% CI [[LOWER LIMIT], [UPPER LIMIT]], d = [EFFECT SIZE].
For example:
A one-sample t test showed that examination scores (M = 78.40, SD = 6.20) were significantly higher than the national benchmark of 75, t(24) = 2.74, p = .011, 95% CI [0.84, 5.96], d = 0.55.
You can use a slightly shorter version when you do not need to report the confidence interval or effect size:
A one-sample t test showed that [VARIABLE] (M = [MEAN], SD = [STANDARD DEVIATION]) was significantly [higher/lower] than [TEST VALUE], t([DF]) = [T VALUE], p = [P VALUE].
For a nonsignificant result, use:
A one-sample t test showed that [VARIABLE] (M = [MEAN], SD = [STANDARD DEVIATION]) did not differ significantly from the [DESCRIPTION OF BENCHMARK] of [TEST VALUE], t([DF]) = [T VALUE], p = [P VALUE].
Do not describe a nonsignificant result as evidence that the two values are equal. The test only tells you that you did not find sufficient evidence of a difference.
SPSS Output Used in This Example
We will use the same example from our guide on running a one-sample t test in SPSS.
Suppose a researcher wants to determine whether university students have a mean examination score that differs from a national benchmark of 75 points.
The sample contains 25 students.
SPSS produces the following descriptive statistics:
| Statistic | Value |
|---|---|
| n | 25 |
| Mean | 78.40 |
| Standard deviation | 6.20 |
| Standard error | 1.24 |
The One-Sample Test table gives:
| Statistic | Value |
|---|---|
| Test value | 75 |
| t | 2.74 |
| df | 24 |
| Two-sided p | .011 |
| Mean difference | 3.40 |
| 95% CI of the difference | [0.84, 5.96] |
The effect size is:
Cohen’s d = 0.55
These values give us everything we need to write the result.
How to Turn SPSS Output Into an APA Result
You do not need to reproduce the SPSS tables in your Results section. Instead, identify the relevant values and combine them into clear academic prose.
For our example, begin with the descriptive statistics:
Students had a mean examination score of 78.40 (SD = 6.20).
Next, identify the benchmark:
The examination scores were compared with a national benchmark of 75.
Then report the inferential result:
The mean score was significantly higher than the benchmark, t(24) = 2.74, p = .011.
You can then add the confidence interval and effect size:
The mean difference was 3.40 points, 95% CI [0.84, 5.96], with Cohen’s d = 0.55.
You can combine these elements into one concise APA-style result:
Students had a mean examination score of 78.40 (SD = 6.20), which was significantly higher than the national benchmark of 75, t(24) = 2.74, p = .011, 95% CI [0.84, 5.96], d = 0.55.
This version gives the reader the main information without repeating the entire SPSS output.
How to Report the Mean and Standard Deviation
Report the sample mean and standard deviation before or alongside the t test result.
For example:
Students had a mean examination score of 78.40 (SD = 6.20).
You can also place both values inside parentheses:
Examination scores were relatively high (M = 78.40, SD = 6.20).
The first version often reads more naturally because it integrates the mean into the sentence.
The mean is important because it shows the direction of the difference. A significant p value tells you that a difference exists, but the sample mean tells you whether the score lies above or below the benchmark.
In our example:
78.40 > 75
The sample mean lies above the test value.
How to Report the t Statistic and Degrees of Freedom
APA style reports the t statistic together with its degrees of freedom.
Use this format:
t(24) = 2.74
The 24 inside parentheses represents the degrees of freedom.
For a one-sample t test:
df = n − 1
Since the sample contains 25 participants:
25 − 1 = 24
You do not write:
t = 2.74, df = 24
when you use the standard APA statistical format.
Instead, write:
t(24) = 2.74
Round the t statistic to a sensible number of decimal places. Two decimal places work well in most reports.
How to Report the p Value
The p value tells you how much statistical evidence the data provide against the null hypothesis under the assumptions of the test.
For our example:
p = .011
Because:
.011 < .05
the result reaches the conventional .05 significance level.
You could therefore write:
Examination scores were significantly higher than the benchmark, t(24) = 2.74, p = .011.
When SPSS displays a value such as:
.032
report:
p = .032
Do not add a leading zero:
p = 0.032
If SPSS displays:
.000
do not report:
p = .000
Instead, write:
p < .001
A probability is not literally zero simply because SPSS rounds the displayed result to three decimal places.
Should You Report the One-Sided or Two-Sided p Value?
Recent versions of SPSS may display separate One-Sided p and Two-Sided p values.
Your hypothesis determines which result you should report.
Use the two-sided p value when your alternative hypothesis asks whether the population mean differs from the test value in either direction:
H₁: μ ≠ 75
This is the appropriate choice for a research question such as:
Does the mean examination score differ from the national benchmark of 75?
Use a one-sided test only when you specified a justified directional hypothesis before examining the results.
For example:
H₁: μ > 75
would test whether the population mean is specifically higher than 75.
Do not look at the results first and then choose the one-sided p value because it produces a smaller number.
For the example in this guide, the original question asks whether the mean differs from 75. We therefore report the two-sided p value of .011.
Older SPSS versions may label the same value Sig. (2-tailed).
How to Report the Mean Difference
SPSS calculates the mean difference as:
Sample mean − Test value
For our example:
78.40 − 75 = 3.40
The sample mean therefore exceeds the benchmark by 3.40 points.
You could report:
The mean examination score was 3.40 points higher than the benchmark.
The mean difference helps readers understand the difference in the original measurement units.
Cohen’s d tells readers about the standardized size of the difference, while the mean difference shows its size in the original scale.
Both measures can therefore provide useful but different information.
How to Report the 95% Confidence Interval
SPSS reports a confidence interval for the mean difference in the One-Sample Test table.
For our example:
95% CI [0.84, 5.96]
You can include it in the result as:
t(24) = 2.74, p = .011, 95% CI [0.84, 5.96].
The square brackets contain the lower and upper confidence limits.
The interval does not include zero. This agrees with the statistically significant two-sided result at the .05 level.
Remember what the interval represents.
SPSS is showing a confidence interval for:
Sample mean − Test value
It is not directly showing the confidence interval around the raw sample mean.
In this example, the estimated population mean lies between approximately 0.84 and 5.96 points above the benchmark.
If you want the corresponding interval for the population mean itself, add the test value to both limits:
75 + 0.84 = 75.84
and:
75 + 5.96 = 80.96
The corresponding confidence interval for the population mean would therefore be approximately:
95% CI [75.84, 80.96]
When reporting SPSS output directly, make it clear whether the interval refers to the mean difference or the population mean.
How to Report Cohen’s d
The p value tells you whether the analysis found statistical evidence of a difference. It does not tell you how large the standardized difference is.
Cohen’s d provides that information.
For our example:
d = 0.55
You can include the effect size in the same sentence:
Students had a mean examination score of 78.40 (SD = 6.20), which was significantly higher than the benchmark of 75, t(24) = 2.74, p = .011, d = 0.55.
Researchers often use values around 0.20, 0.50, and 0.80 as rough reference points for small, medium, and large standardized effects. These values should serve as general guides rather than strict rules because the practical importance of an effect depends on the research context.
For this example, d = 0.55 indicates a moderate standardized difference under the conventional reference points.
If your SPSS version provides an effect-size confidence interval, you may also report it when useful.
What Should Be Italicized in APA Style?
APA statistical notation italicizes statistical symbols such as M, SD, t, p, n, and d. Purdue’s APA statistics guidance also illustrates the use of italics for statistical symbols and parentheses around degrees of freedom.
For example:
Students scored significantly higher than the benchmark (M = 78.40, SD = 6.20), t(24) = 2.74, p = .011, d = 0.55.
Italicize:
- M
- SD
- t
- p
- n
- d
Do not italicize:
- numerical values;
- parentheses;
- equals signs;
- commas;
- confidence interval brackets;
- the words “mean” or “standard deviation” when you spell them out.
For example, only the statistical symbols appear in italics in:
t(24) = 2.74, p = .011
Do not italicize the complete expression.
Complete APA Results Paragraph
A Results section should do more than list statistics. It should tell the reader why you conducted the test and what the analysis found.
Using our exam-score example, you could write:
A one-sample t test was conducted to determine whether the mean examination score differed from the national benchmark of 75. Students had a mean score of 78.40 (SD = 6.20), which was significantly higher than the benchmark, t(24) = 2.74, p = .011. The mean difference was 3.40 points, 95% CI [0.84, 5.96], and the standardized effect was moderate, Cohen’s d = 0.55. These results indicate that students in the sample scored higher, on average, than the benchmark value.
This paragraph includes the main information needed to understand the test:
- the purpose of the analysis;
- the benchmark;
- the sample mean;
- the standard deviation;
- the t statistic;
- degrees of freedom;
- the p value;
- the mean difference;
- the confidence interval;
- the effect size;
- a brief interpretation.
You do not need to discuss the possible reasons for the higher scores in the Results section. Save explanations and broader implications for the Discussion section unless your institution uses a different structure.
Short APA Reporting Example
Not every assignment requires a full paragraph.
A shorter result could be:
Students had a significantly higher mean examination score (M = 78.40, SD = 6.20) than the benchmark of 75, t(24) = 2.74, p = .011.
If your lecturer or journal expects effect sizes, add:
Students had a significantly higher mean examination score (M = 78.40, SD = 6.20) than the benchmark of 75, t(24) = 2.74, p = .011, d = 0.55.
If you also need the confidence interval:
Students had a significantly higher mean examination score (M = 78.40, SD = 6.20) than the benchmark of 75, t(24) = 2.74, p = .011, 95% CI [0.84, 5.96], d = 0.55.
Choose the level of detail that matches your assignment, dissertation, or publication requirements.
How to Report a Nonsignificant One-Sample t Test
You should report a nonsignificant result just as carefully as a significant one.
Suppose another study compares a sample mean with a benchmark of 75 and produces:
M = 76.20
SD = 7.10
t(24) = 0.85
p = .404
95% CI [−1.71, 4.11]
You could write:
The mean examination score (M = 76.20, SD = 7.10) did not differ significantly from the benchmark of 75, t(24) = 0.85, p = .404, 95% CI [−1.71, 4.11].
Notice the wording.
Do not write:
The examination score was the same as 75.
The sample mean is clearly 76.20 rather than 75.
The analysis simply did not provide sufficient evidence that the population mean differed from 75.
The confidence interval also includes zero, which is consistent with the nonsignificant result.
How to Report a Negative t Statistic
A negative t statistic does not indicate an error.
It usually means the sample mean lies below the test value.
Suppose:
Test value = 75
Sample mean = 71.80
t(24) = −2.36
p = .027
You could report:
Students had a mean examination score of 71.80 (SD = 6.78), which was significantly lower than the benchmark of 75, t(24) = −2.36, p = .027.
The negative sign communicates the direction of the difference.
It is usually best to preserve the sign of the t statistic because it agrees with the direction of the comparison.
How to Report a One-Sided One-Sample t Test
If you planned and justified a directional hypothesis before analyzing the data, you may report a one-sided result.
Suppose your hypothesis stated:
Students would score higher than the benchmark of 75.
If SPSS produced a one-sided p value of .006, you could write:
Students had a mean examination score of 78.40 (SD = 6.20), which was significantly higher than the benchmark of 75, t(24) = 2.74, one-sided p = .006.
Including the words one-sided removes ambiguity.
If you use a two-sided test, you normally do not need to write “two-sided” in every APA result unless the distinction matters for your report.
Do You Need an APA Table for a One-Sample t Test?
For a single one-sample t test, a table is often unnecessary.
A clear sentence can communicate the complete result more efficiently.
A table becomes more useful when you run several one-sample t tests or need to compare results across several outcomes.
For example:
Table 1
One-Sample t Test Results Against a Benchmark of 75
| Variable | n | M | SD | t | df | p | Mean Difference | 95% CI | d |
|---|---|---|---|---|---|---|---|---|---|
| Examination score | 25 | 78.40 | 6.20 | 2.74 | 24 | .011 | 3.40 | [0.84, 5.96] | 0.55 |
If you provide this information in a table, do not repeat every value in the accompanying paragraph.
You might write:
Table 1 presents the one-sample t test results. Examination scores were significantly higher than the benchmark of 75.
The table contains the detailed statistics, while the text highlights the finding that matters.
One-Sample t Test APA Reporting Checklist
Before submitting your Results section, check that you have:
- identified the variable you tested;
- stated the benchmark or test value;
- reported the sample mean;
- reported the standard deviation;
- included the t statistic;
- placed the degrees of freedom in parentheses after t;
- reported the correct p value;
- used p < .001 instead of p = .000 where necessary;
- stated whether the sample mean was higher, lower, or not significantly different;
- reported the confidence interval when appropriate;
- made clear what the confidence interval represents;
- included an effect size when useful or required;
- italicized statistical symbols correctly;
- avoided claiming that a nonsignificant result proves equality;
- avoided copying the raw SPSS table directly into your Results section.
Common Mistakes When Reporting One-Sample t Test Results
Several mistakes appear frequently in student reports.
- Reporting only the p value. A p value alone does not tell the reader the sample mean, direction, or size of the difference.
- Leaving out the benchmark. Readers need to know what value you compared the sample mean against.
- Writing p = .000. Report very small values as p < .001.
- Adding a leading zero to p. Write p = .011 rather than p = 0.011.
- Ignoring the sample mean. The mean helps you determine whether the sample lies above or below the test value.
- Calling a nonsignificant result equal. A nonsignificant result does not establish exact equality.
- Misreading the confidence interval. The confidence interval in the standard SPSS One-Sample Test table refers to the mean difference.
- Reporting statistical significance without an effect size when your reporting requirements call for one. The p value and effect size answer different questions.
- Using the one-sided p value after seeing the result. Choose the direction of the hypothesis before analyzing the data.
- Copying SPSS output into the paper. Translate the relevant statistics into clear APA-style prose or an appropriate table.
Need Help Reporting Your One-Sample t Test?
Running the test in SPSS is only part of the process. You also need to know which values matter, how to interpret them, and how to present the result correctly.
If you are working with your own assignment, dissertation, thesis, or research project, you can work one-to-one with a tutor through spss-tutors.com.
Your tutor can help you understand your SPSS output, interpret the results, and learn how to report the analysis correctly in APA style.
Frequently Asked Questions
How do you report a one-sample t test in APA style?
Report the sample mean, standard deviation, benchmark, t statistic, degrees of freedom, and p value.
For example:
Examination scores (M = 78.40, SD = 6.20) were significantly higher than the benchmark of 75, t(24) = 2.74, p = .011.
You can also include the confidence interval and effect size.
What is the APA format for a t statistic?
Use:
t(df) = value
For example:
t(24) = 2.74
The number inside parentheses represents the degrees of freedom.
What should be italicized in a one-sample t test result?
Italicize statistical symbols such as M, SD, t, p, n, and d.
Do not italicize the numbers, equals signs, parentheses, commas, or confidence interval brackets.
Should I report the mean and standard deviation?
Yes. The mean and standard deviation provide important context for the hypothesis test.
For example:
M = 78.40, SD = 6.20
The mean also helps readers understand whether the sample lies above or below the benchmark.
Should I report the exact p value?
Report the exact p value when it is practical to do so.
For example:
p = .011
If the value is smaller than .001, report:
p < .001
Do not report p = .000.
Do I need to report Cohen’s d?
An effect size provides information about the magnitude of the standardized difference and often strengthens the report.
Whether you must include it depends on your course, institution, journal, or reporting requirements.
What does the confidence interval represent in SPSS?
The confidence interval in the standard SPSS One-Sample Test table refers to the mean difference, which SPSS calculates as:
Sample mean − Test value
Make this clear when you report the interval.
How do I report a nonsignificant one-sample t test?
State that the sample mean did not differ significantly from the test value.
For example:
Examination scores (M = 76.20, SD = 7.10) did not differ significantly from the benchmark of 75, t(24) = 0.85, p = .404.
Do not say that the two values were proven to be equal.
How do I report SPSS Sig. (2-tailed) in APA style?
The Sig. (2-tailed) value in older SPSS output is the two-sided p value.
If SPSS reports .011, write:
p = .011
Newer SPSS versions may label the same result Two-Sided p.
Should I include an APA table?
You usually do not need a table for one simple one-sample t test because a single sentence can communicate the result clearly.
A table becomes useful when you report several tests, several outcomes, or a larger collection of related statistics.
Where can I learn how to run the test in SPSS?
See our step-by-step guide on How to Run a One-Sample t Test in SPSS. It explains the assumptions, SPSS menu steps, output tables, confidence interval, p value, and effect size.