
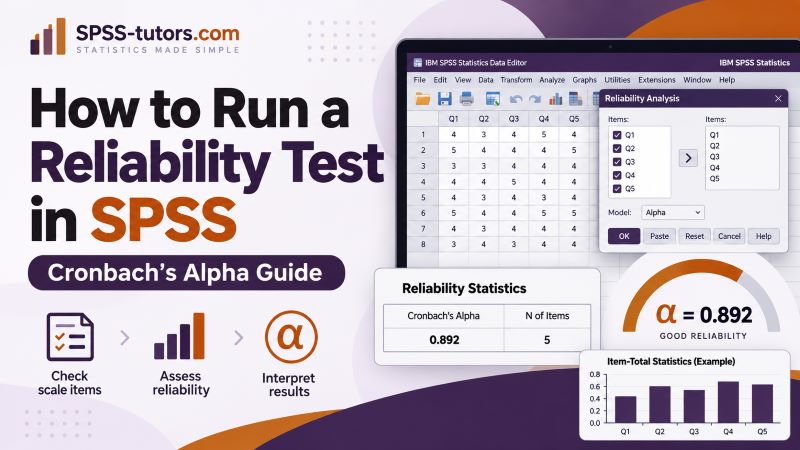
A reliability test helps you determine whether a group of questionnaire or scale items measures a construct consistently. In SPSS, researchers commonly assess internal consistency using Cronbach’s alpha. To run a reliability test in SPSS, go to Analyze > Scale > Reliability Analysis, move the items that belong to the same scale into the Items box, keep Model set to Alpha, request the item and scale statistics, and click OK.
SPSS will calculate Cronbach’s alpha and can also show how each item relates to the overall scale.
However, running the procedure is only part of the analysis. You also need to know which items belong together, whether any items require reverse coding, how to interpret the corrected item-total correlations, and whether removing an item actually makes sense.
This beginner-friendly guide walks through the complete process using one example.
What Is a Reliability Test in SPSS?
A reliability test examines how consistently several items work together as a scale.
Suppose you use six questionnaire items to measure academic confidence. Each item uses a 5-point response scale from: 1 = Strongly disagree to: 5 = Strongly agree
If all six items are intended to measure the same underlying construct, their responses should show some degree of consistency.
Cronbach’s alpha summarizes this internal consistency using a coefficient that usually ranges from 0 to 1.
A higher value generally indicates that the items relate more strongly as a scale.
For example:
Cronbach’s α = .82 would usually suggest stronger internal consistency than Cronbach’s α = .52
However, you should not judge a questionnaire from the alpha value alone. Item content, the number of items, dimensionality, corrected item-total correlations, and the purpose of the scale also matter.
Note. Reliability also does not mean validity. A scale can produce consistent responses without measuring the construct that the researcher actually intended to measure.
When Should You Run Cronbach’s Alpha?
Cronbach’s alpha is useful when several items are intended to contribute to the same scale or construct.
Common examples include scales that measure:
- academic confidence;
- job satisfaction;
- anxiety;
- organizational commitment;
- perceived support;
- stress;
- motivation;
- attitudes;
- service quality.
For example, a questionnaire may contain six questions designed to measure student satisfaction.
If those six items form one scale, you can examine their internal consistency before calculating the final satisfaction score.
Do not run Cronbach’s alpha simply because several questions use the same Likert response options.
The items should have a conceptual reason to belong together.
For example, suppose a questionnaire contains:
- five stress items;
- six job-satisfaction items;
- four organizational-support items.
You should normally run separate reliability analyses for the three scales rather than place all 15 items into one reliability test.
What Does Cronbach’s Alpha Actually Measure?
Cronbach’s alpha describes the internal consistency of a set of items.
In simple terms, it asks:
Do these items behave enough like parts of the same scale?
If respondents who score high on one item also tend to score high on related items, the items will usually show stronger positive relationships.
Alpha reflects those relationships along with the number of items in the scale.
This point matters because alpha can increase when a scale contains more items. A high coefficient does not automatically mean that every item is useful or that the scale measures only one construct.
You should therefore interpret the overall alpha alongside the item-level statistics.
Example Used in This Guide
Suppose a researcher develops a six-item scale to measure academic confidence among university students.
The items use a 5-point Likert scale.
| Item | Statement |
|---|---|
| AC1 | I feel confident completing difficult academic tasks. |
| AC2 | I can understand challenging course material. |
| AC3 | I can solve academic problems independently. |
| AC4 | I often feel unable to handle difficult coursework. |
| AC5 | I am confident that I can meet my academic goals. |
| AC6 | I can manage demanding academic tasks successfully. |
Notice that AC4 points in the opposite direction.
For AC1, AC2, AC3, AC5, and AC6, a high score means more academic confidence. However, for AC4, a high score means less academic confidence.
Before running the final reliability analysis, we therefore need to reverse-code AC4.
Before Running the Reliability Test
Do not open the Reliability Analysis dialog box immediately.
A few checks before the analysis can prevent misleading results.
Make Sure the Items Measure the Same Construct
First, identify which questionnaire items belong to the scale.
Do not combine variables simply because they appear next to each other in your dataset.
If your questionnaire contains different subscales, analyze each subscale separately.
For example:
Academic confidence: AC1–AC6
Academic stress: AS1–AS5
Social support: SS1–SS7
These represent three different constructs, so they should normally have three separate reliability analyses.
Check the Direction of the Items
All items in a scale should point in a consistent scoring direction before you calculate a composite score.
Suppose most items use:
Higher score = greater confidence
but one negatively worded item uses:
Higher score = lower confidence
That item needs reverse coding if the scale instructions require it.
If you fail to reverse-code it, the item may correlate negatively with the other items and reduce Cronbach’s alpha.
Check the Coding
Review the minimum and maximum values.
For a scale ranging from 1 to 5, values such as:
0, 6, 44, or 99
may indicate coding errors unless you intentionally use those values for missing data or another purpose.
You can inspect your items using:
Analyze > Descriptive Statistics > Frequencies
or:
Analyze > Descriptive Statistics > Descriptives
Our guide on How to Run Descriptive Statistics in SPSS explains these procedures in detail.
Check Missing Values
Missing responses can reduce the number of cases available for reliability analysis.
Later, check the Case Processing Summary in the SPSS output to confirm how many participants contributed to the reliability estimate.
If the number of valid cases is much lower than expected, inspect your missing data before interpreting the result.
How to Reverse-Code an Item in SPSS
In our example, AC4 is negatively worded:
I often feel unable to handle difficult coursework.
The other items point toward greater confidence.
For a 1-to-5 scale, reverse scoring follows this pattern:
| Original score | Reversed score |
|---|---|
| 1 | 5 |
| 2 | 4 |
| 3 | 3 |
| 4 | 2 |
| 5 | 1 |
In SPSS, go to:
Transform > Recode into Different Variables
Select AC4 and move it into the input variable box.
Give the new variable a clear name, such as:
AC4_R
Then click Old and New Values.
Enter the recoding pairs:
1 → 5
2 → 4
3 → 3
4 → 2
5 → 1
Continue and complete the recode.
Use AC4_R rather than the original AC4 when you run the reliability analysis.
Creating a new variable is usually safer than overwriting the original because it preserves the raw response for checking later.
How to Run a Reliability Test in SPSS
Once your data are ready, you can run Cronbach’s alpha.
Step 1: Open Reliability Analysis
From the SPSS menu, select:
Analyze > Scale > Reliability Analysis
SPSS will open the Reliability Analysis dialog box.
Step 2: Select the Scale Items
Move the items that belong to your scale into the Items box.
For our academic-confidence example, select:
AC1
AC2
AC3
AC4_R
AC5
AC6
Do not include the original AC4 because we already created a correctly scored version.
Also avoid placing unrelated variables such as age, gender, participant ID, or academic program into the Items box.
Step 3: Select Alpha as the Reliability Model
Look at the Model drop-down menu.
Select: Alpha
SPSS often uses Alpha as the default model.
This tells SPSS to calculate Cronbach’s alpha.
Step 4: Request the Important Statistics
Click Statistics.
Under Descriptives for, select:
- Item
- Scale
- Scale if item deleted
Under the inter-item options, select:
- Correlations
These options give you much more useful information than the overall alpha alone.
Click Continue.
Step 5: Run the Analysis
Click OK.
SPSS will send the reliability results to the Output Viewer.
The most useful output usually includes:
- Case Processing Summary
- Reliability Statistics
- Item Statistics
- Inter-Item Correlation Matrix
- Item-Total Statistics
You do not need to report every table, but each one can help you diagnose the scale.
How to Interpret the Case Processing Summary
The Case Processing Summary tells you how many participants SPSS included in the reliability analysis.
Suppose your dataset contains 120 students, but four students have missing values on one or more items.
SPSS might show:
| Cases | N | % |
|---|---|---|
| Valid | 116 | 96.7 |
| Excluded | 4 | 3.3 |
| Total | 120 | 100.0 |
This means the reliability analysis used 116 complete cases.
Always check this table before interpreting Cronbach’s alpha.
If you expected 120 valid cases but SPSS used only 85, investigate the missing data or filters before continuing.
How to Interpret the Reliability Statistics Table
The Reliability Statistics table contains the overall Cronbach’s alpha.
Suppose SPSS reports:
| Cronbach’s Alpha | N of Items |
|---|---|
| .823 | 6 |
The scale contains six items and has:
Cronbach’s α = .823
This suggests good internal consistency under commonly used guidelines.
The coefficient indicates that the items show a reasonably strong level of consistency as a scale.
However, do not stop here.
The overall alpha does not tell you whether one item behaves poorly or whether removing an item would improve or damage the scale.
For that information, examine the Item-Total Statistics table.
What Is a Good Cronbach’s Alpha?
Researchers often use .70 as a general reference point for acceptable internal consistency.
A rough interpretation guide is:
| Cronbach’s alpha | General interpretation |
|---|---|
| Below .60 | Low internal consistency |
| .60–.69 | Questionable or may need review |
| .70–.79 | Often considered acceptable |
| .80–.89 | Good |
| .90 and above | Very high |
These ranges are guidelines, not universal rules.
Acceptable reliability depends on factors such as:
- the purpose of the scale;
- number of items;
- stage of research;
- discipline;
- consequences of measurement error;
- whether you are using an established instrument.
A coefficient slightly below .70 does not automatically make a scale unusable.
Likewise, a coefficient above .90 does not automatically make a scale excellent.
An extremely high alpha may sometimes suggest that several items are very similar or redundant.
Always interpret the coefficient in context.
How to Interpret the Item Statistics Table
The Item Statistics table shows the mean and standard deviation of each item.
For example:
| Item | Mean | Std. Deviation |
|---|---|---|
| AC1 | 3.78 | 0.82 |
| AC2 | 3.64 | 0.91 |
| AC3 | 3.52 | 0.87 |
| AC4_R | 3.41 | 0.95 |
| AC5 | 3.81 | 0.76 |
| AC6 | 3.69 | 0.84 |
These statistics can help you spot unusual items.
For example, if five items have means close to 4 but one item has a mean of 1.2, check whether that item:
- uses the opposite scoring direction;
- contains a coding error;
- measures something different;
- has an unusual response pattern.
The item statistics do not determine reliability by themselves, but they can reveal problems worth investigating.
How to Interpret the Corrected Item-Total Correlation
The Corrected Item-Total Correlation is one of the most useful columns in the output.
It shows how strongly each item relates to the total score formed from the other items.
Suppose SPSS reports:
| Item | Corrected Item-Total Correlation |
|---|---|
| AC1 | .61 |
| AC2 | .68 |
| AC3 | .57 |
| AC4_R | .49 |
| AC5 | .63 |
| AC6 | .58 |
All six values are positive and reasonably strong.
A commonly used rule of thumb is that values around .30 or higher suggest that the item contributes reasonably to the scale.
If you see a very low value, investigate the item.
For example:
Corrected Item-Total Correlation = .08
may indicate that the item does not behave like the rest of the scale.
A negative value deserves even closer attention.
It may indicate:
- a negatively worded item that was not reverse-coded;
- incorrect data coding;
- an item measuring a different construct;
- a poorly worded question.
Do not immediately delete an item because its corrected item-total correlation falls below .30.
First, examine the wording, theoretical role, scoring instructions, and data quality.
How to Interpret Cronbach’s Alpha if Item Deleted
The Cronbach’s Alpha if Item Deleted column tells you what the overall alpha would become if you removed each item.
Suppose the overall alpha is:
α = .823
and SPSS reports:
| Item | Alpha if Item Deleted |
|---|---|
| AC1 | .795 |
| AC2 | .781 |
| AC3 | .803 |
| AC4_R | .821 |
| AC5 | .789 |
| AC6 | .801 |
Removing any item would either reduce alpha or produce almost no meaningful improvement.
There is therefore no obvious reliability reason to delete an item.
Suppose, however, AC4_R produced:
Alpha if Item Deleted = .872
while the overall alpha remained:
α = .823
That result would tell you that alpha would increase if you removed AC4_R.
You should then investigate the item.
Do not automatically delete it.
Ask:
- Does the item belong to the construct theoretically?
- Was it reverse-coded correctly?
- Does it contain a data-entry error?
- Is the wording confusing?
- Does the published instrument require the item?
- Would removing it change the meaning of the scale?
Deleting items only to push alpha above a desired threshold can damage the content of the scale.
Should You Delete an Item to Increase Cronbach’s Alpha?
Not necessarily.
A small increase in alpha does not automatically justify removing an item.
Suppose:
Overall α = .742
and deleting one item gives:
α = .748
That difference is tiny.
Removing a theoretically important item simply to gain .006 in alpha may make little sense.
Item removal should consider both statistics and theory.
If you use a published questionnaire, be especially cautious about changing the scale. Removing an item can mean that you are no longer using the original instrument exactly as validated.
If your dissertation or study modifies an established scale, document the change and explain why you made it.
How to Interpret the Inter-Item Correlation Matrix
The Inter-Item Correlation Matrix shows correlations between every pair of items.
You do not always need this table for basic reporting, but it can help you investigate unusual reliability results.
Look for items that show:
- negative correlations with most other items;
- correlations close to zero;
- extremely high correlations with another item.
A negative pattern may suggest a scoring-direction problem.
Correlations close to zero may suggest that an item does not relate well to the rest of the scale.
Extremely high correlations between two items may suggest that the questions are almost duplicates.
Use the matrix as a diagnostic tool rather than trying to report every correlation.
What Does a Negative Cronbach’s Alpha Mean?
Cronbach’s alpha can sometimes be negative.
A negative alpha usually signals a serious problem with the item relationships or coding.
Common causes include:
An Item Was Not Reverse-Coded
This is one of the first things to check.
If one item runs in the opposite direction from the rest, it may produce negative correlations and pull alpha downward.
The Items Do Not Measure the Same Construct
You may have combined unrelated questions into one reliability analysis.
For example, mixing stress, satisfaction, and motivation items into a single scale can create inconsistent item relationships.
Coding Errors
Incorrect values can also distort the result.
Check that all responses fall within the intended scale range.
A negative alpha is not something you should simply report and move past. Investigate the scoring and scale structure first.
What if Cronbach’s Alpha Is Very High?
A high alpha often indicates strong internal consistency.
However, an extremely high coefficient should not automatically be treated as better.
For example:
α = .97
may indicate excellent consistency, but it may also mean that several questions are asking nearly the same thing.
Review the items for unnecessary repetition.
A useful scale should measure the construct consistently while still covering the important aspects of that construct.
What if Cronbach’s Alpha Is Below .70?
Do not immediately start deleting items.
First, work through several checks.
Check Reverse Coding
Confirm that all negatively worded items were scored in the correct direction.
Check for Data Errors
Review minimum and maximum values.
Check Corrected Item-Total Correlations
Look for items that have weak or negative relationships with the remaining scale.
Check Alpha if Item Deleted
Identify whether one item appears to reduce consistency substantially.
Review the Item Content
An item may not fit the construct as well as expected.
Check Whether You Combined Different Subscales
A questionnaire may contain several dimensions.
One overall alpha can hide those differences.
If the instrument contains separate subscales, analyze their reliability separately.
Should You Run One Reliability Test for the Whole Questionnaire?
Only if the questionnaire genuinely represents one scale.
Suppose a 24-item questionnaire contains:
- 8 motivation items;
- 8 stress items;
- 8 satisfaction items.
Running Cronbach’s alpha for all 24 items together would usually not answer the reliability question for the three constructs.
Instead, run:
- Reliability analysis 1: Motivation items
- Reliability analysis 2: Stress items
- Reliability analysis 3: Satisfaction items
Each scale receives its own Cronbach’s alpha and item-level diagnostics.
This is especially important when a questionnaire comes from a published instrument with established subscales.
Does a High Cronbach’s Alpha Prove That a Scale Is Valid?
No.
Reliability and validity answer different questions.
Reliability asks:
Do the items produce consistent measurement?
Validity asks:
Are the items actually measuring the construct they are supposed to measure?
A scale can have a high Cronbach’s alpha but still measure the wrong concept.
Likewise, alpha does not prove that all items form one single dimension.
If you need to examine the underlying structure of a set of items, methods such as factor analysis may provide more appropriate evidence.
Cronbach’s Alpha vs. McDonald’s Omega in SPSS
Cronbach’s alpha remains one of the most commonly reported measures of internal consistency.
Current versions of SPSS also provide McDonald’s omega as a reliability model.
Omega can be useful when the assumptions behind alpha do not fit the measurement model well.
For a beginner following a course or dissertation requirement, use the reliability statistic your instructor, supervisor, field, or scale documentation requires.
If you need Cronbach’s alpha, keep Model = Alpha in the Reliability Analysis dialog box.
Do not switch statistics simply because one gives a higher number.
What Should You Do After Reliability Is Acceptable?
If the items show acceptable reliability and they are meant to form one scale, the next step may involve creating a composite score.
For example, you may calculate the:
- mean of the items;
- sum of the items.
Follow the scoring instructions for the questionnaire whenever they exist.
In SPSS, go to:
Transform > Compute Variable
You might create a variable called:
Academic_Confidence
using a formula based on the six correctly scored items.
For example:
MEAN(AC1, AC2, AC3, AC4_R, AC5, AC6)
Before calculating the final score, make sure that:
- reverse coding is complete;
- the items belong to the intended scale;
- you have decided how to handle missing values;
- the scoring method matches the scale instructions.
Do not calculate a composite score simply because alpha exceeds .70. The scale should also make conceptual sense.
How to Run Cronbach’s Alpha Using SPSS Syntax
You can also run reliability analysis using syntax.
For the six academic-confidence items, the syntax might look like:
RELIABILITY
  /VARIABLES=AC1 AC2 AC3 AC4_R AC5 AC6
  /SCALE('Academic Confidence') ALL
  /MODEL=ALPHA
  /STATISTICS=DESCRIPTIVE SCALE CORR
  /SUMMARY=TOTAL.
This syntax requests:
- Cronbach’s alpha;
- item descriptives;
- scale statistics;
- inter-item correlations;
- item-total statistics.
Syntax is especially useful in dissertations and larger research projects because it keeps a reproducible record of the analysis.
If you change the dataset later, you can rerun the same commands without rebuilding every dialog box.
How to Report Cronbach’s Alpha
A basic reliability result can be very short.
For example:
The six-item Academic Confidence Scale demonstrated good internal consistency, Cronbach’s α = .82.
If you modified the scale or removed an item, report that decision clearly.
For example:
The initial six-item scale produced Cronbach’s α = .68. One item showed a low corrected item-total correlation and was removed after review of its content and scoring. The remaining five-item scale produced α = .76.
Do not hide item removal simply because the final coefficient looks better.
Your reader should understand how you arrived at the final scale.
We will cover formatting, examples, tables, and APA wording in more detail in our guide on How to Report Reliability Analysis in APA Style.
Common Mistakes When Running Reliability Analysis in SPSS
Several mistakes can produce misleading results.
- Running alpha on every questionnaire item at once. Analyze items that belong to the same construct or subscale.
- Forgetting to reverse-code negatively worded items. Check scoring direction before running the final reliability test.
- Including the final composite score in the Items box. Reliability analysis should use the component items, not the scale score created from them.
- Including demographic variables. Age, gender, study program, participant ID, and similar variables usually do not belong in the scale.
- Looking only at Cronbach’s alpha. Check the corrected item-total correlations and alpha if item deleted.
- Automatically deleting every item below .30. Review the content, scoring, theory, and scale instructions before removing an item.
- Trying to maximize alpha at any cost. A larger coefficient does not automatically create a better measurement scale.
- Treating reliability as validity. Internal consistency does not prove that the scale measures the intended construct.
- Ignoring missing cases. Check the Case Processing Summary before interpreting the coefficient.
- Running one alpha for multiple subscales. Analyze distinct constructs separately.
Reliability Analysis Checklist
Before you finish your SPSS reliability analysis, confirm that:
- the items belong to the same intended scale;
- separate constructs have separate reliability analyses;
- negatively worded items have the correct scoring direction;
- the values fall within the expected response range;
- missing data have been checked;
- the correct items appear in the Items box;
- Model is set to Alpha when you want Cronbach’s alpha;
- you requested Item, Scale, and Scale if item deleted statistics;
- you checked the number of valid cases;
- you interpreted the overall alpha;
- you reviewed corrected item-total correlations;
- you examined alpha if item deleted;
- you investigated negative or unusual item relationships;
- you considered theory before removing any item;
- you understand that reliability does not prove validity;
- you only create a composite score when the scale design supports it.
Need Help With Reliability Analysis in SPSS?
Reliability analysis becomes much easier once you understand what the items are supposed to measure and how each SPSS table contributes to the decision.
If you are working with a questionnaire, assignment, dissertation, thesis, or research project, you can work one-to-one with a tutor through SPSS-tutors.com.
Your tutor can help you check item scoring, run Cronbach’s alpha, interpret corrected item-total correlations, investigate weak items, and understand what your reliability results mean.
Frequently Asked Questions
How do I run a reliability test in SPSS?
Go to:
Analyze > Scale > Reliability Analysis
Move the items that belong to the same scale into the Items box, choose Alpha as the model, click Statistics, select the item and scale statistics, and click OK.
SPSS will calculate Cronbach’s alpha and the requested item-level statistics.
What is Cronbach’s alpha in SPSS?
Cronbach’s alpha is a measure of internal consistency.
It helps you examine whether several questionnaire or scale items work together consistently as a measure.
What Cronbach’s alpha value is acceptable?
Researchers commonly use .70 as a general reference point, but it is not a universal cutoff.
Interpret alpha in relation to the type of scale, number of items, purpose of the study, disciplinary expectations, and other item-level evidence.
Is .80 a good Cronbach’s alpha?
An alpha around .80 generally indicates good internal consistency under common guidelines.
You should still review the item-total statistics and make sure the scale makes conceptual sense.
What does a low corrected item-total correlation mean?
It means the item has a weak relationship with the score formed from the other items.
A value below roughly .30 often deserves investigation, but you should not delete an item automatically.
Check the wording, scoring, theory, and scale instructions first.
What does Cronbach’s Alpha if Item Deleted mean?
It shows what the scale’s alpha would become if you removed that particular item.
If the value increases substantially, the item may deserve closer review.
However, statistical improvement alone does not justify item deletion.
Do I reverse-code negative items before Cronbach’s alpha?
Yes, when the scoring scheme requires all items to point in the same direction.
For a 1-to-5 item, reverse coding usually changes 1 to 5, 2 to 4, 3 remains 3, 4 to 2, and 5 to 1.
Why is my Cronbach’s alpha negative?
Common causes include an item scored in the opposite direction, coding errors, or items that do not belong to the same construct.
Check reverse coding and the inter-item relationships before interpreting a negative coefficient.
Should I delete an item if alpha increases?
Not automatically.
Review the corrected item-total correlation, size of the improvement, wording of the item, theoretical importance, and scoring instructions.
For an established scale, removing an item may also change the instrument from its validated form.
Can Cronbach’s alpha be too high?
A very high alpha may indicate strong internal consistency, but values approaching 1 can sometimes suggest that items are repetitive.
Review the questionnaire to make sure several items are not asking almost the same question.
Should I run reliability separately for each subscale?
Yes, when the questionnaire contains distinct subscales that measure different constructs.
For example, motivation, stress, and satisfaction should normally receive separate reliability analyses if they represent separate scales.
Does Cronbach’s alpha test validity?
No.
Cronbach’s alpha measures internal consistency. It does not prove that the scale measures the intended construct.
Does a high alpha prove the items are one-dimensional?
No.
A high Cronbach’s alpha does not by itself show that all items measure one underlying dimension.
If dimensionality matters, consider appropriate methods such as factor analysis.
Can I use Cronbach’s alpha for Likert items?
Yes. Researchers commonly use Cronbach’s alpha for a set of Likert-type items designed to contribute to the same scale.
The items should belong together conceptually, and you should score them consistently before running the analysis.
Can I run Cronbach’s alpha for a single question?
No.
Internal consistency requires multiple items. A single item does not provide a set of item relationships from which Cronbach’s alpha can assess internal consistency.
What do I do after Cronbach’s alpha is acceptable?
If the items form an appropriate scale, you may create the composite score using a mean or sum according to the instrument’s scoring rules.
You can then use that scale score in later descriptive or inferential analyses.