
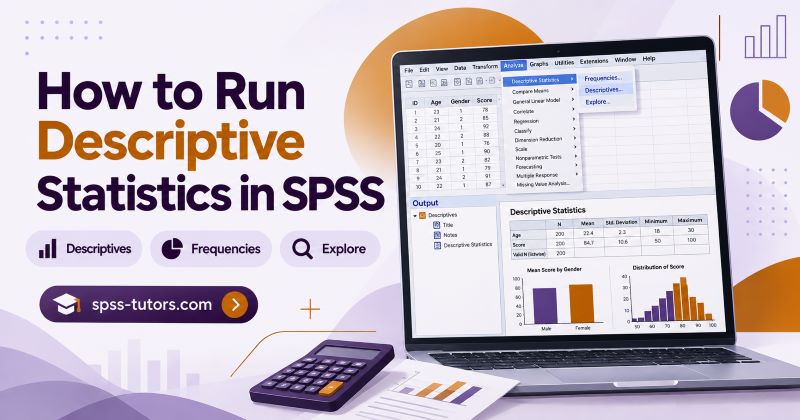
Descriptive statistics are usually one of the first things you examine after entering or cleaning your data in SPSS. They help you see what your data look like before you move on to tests such as a t-test, ANOVA, correlation, or regression.
To run basic descriptive statistics for numerical variables in SPSS, go to Analyze > Descriptive Statistics > Descriptives, move the variables you want to summarize into the Variable(s) box, choose the statistics you need, and click OK.
However, Descriptives is not always the right procedure. SPSS also provides Frequencies for counts, percentages, medians, and modes, and Explore when you need more detailed information about a numerical variable.
This guide shows you which option to use, how to run each procedure, and how to interpret the output.
Which Descriptive Statistics Procedure Should You Use in SPSS?
The first decision is not which button to click. It is what type of variable you are trying to describe.
SPSS provides several procedures under Analyze > Descriptive Statistics, and they serve different purposes.
| What you need | Recommended SPSS procedure |
|---|---|
| Mean, standard deviation, minimum, maximum | Descriptives |
| Frequencies and percentages | Frequencies |
| Median and mode | Frequencies |
| Quartiles and percentiles | Frequencies or Explore |
| Detailed summaries of numerical variables | Explore |
| Descriptive statistics by group | Explore |
| Boxplots and distribution information | Explore |
| Skewness and kurtosis | Descriptives, Frequencies, or Explore |
For a continuous variable such as age, test score, height, or a questionnaire scale score, Descriptives is often the quickest option.
For a categorical variable such as gender, employment status, study program, or treatment group, use Frequencies.
Use Explore when you want to examine a numerical variable in more detail, investigate its distribution, identify possible outliers, or obtain descriptive statistics separately for different groups.
Check Your Variables Before Running the Analysis
Before calculating anything, make sure you understand what each variable represents.
Consider a dataset containing these four variables:
| Variable | Type | Useful descriptive statistics |
|---|---|---|
| Age | Scale | Mean, SD, minimum, maximum |
| Gender | Nominal | Frequency and percentage |
| Satisfaction level | Ordinal | Frequency, percentage, median |
| Academic stress score | Scale | Mean, SD, minimum, maximum |
A common beginner mistake is to request a mean for every variable simply because SPSS can calculate one.
Suppose gender has been coded as:
1 = Male
2 = Female
SPSS can calculate an average of those numbers, but that mean does not provide a meaningful description of gender. Frequencies and percentages are more appropriate.
The statistics you select should therefore match the meaning and measurement level of the variable.
How to Run Descriptive Statistics in SPSS Using Descriptives
The Descriptives procedure is useful when you want a quick summary of one or more numerical variables.
Suppose you have collected data from university students and want to describe their weekly study hours.
Step 1: Open Descriptives
From the SPSS menu, select:
Analyze > Descriptive Statistics > Descriptives
The Descriptives dialog box will open.
Step 2: Select Your Variables
Find the numerical variable you want to summarize in the variable list.
Move it into the Variable(s) box.
You can select several numerical variables at the same time. For example, you could include:
Age
Study Hours
Academic Stress Score
Satisfaction Score
SPSS will calculate descriptive statistics for each selected variable.
Step 3: Choose the Statistics
Click Options.
For a basic descriptive analysis, the most useful statistics are usually:
Mean — the arithmetic average.
Standard deviation — describes how much observations tend to vary around the mean.
Minimum — the lowest observed value.
Maximum — the highest observed value.
Depending on your purpose, you can also request variance, range, sum, skewness, and kurtosis.
Click Continue when you have selected the statistics you need.
Step 4: Run the Analysis
Click OK.
SPSS will send the results to the Output Viewer.
You might obtain a table similar to this:
| Variable | N | Minimum | Maximum | Mean | Std. Deviation |
|---|---|---|---|---|---|
| Weekly study hours | 120 | 6.00 | 28.00 | 16.42 | 4.86 |
How to Interpret the SPSS Descriptives Table
The table above tells us several things about weekly study hours.
N = 120 means 120 valid observations were included in the analysis.
The minimum of 6.00 indicates that the lowest reported study time was 6 hours per week.
The maximum of 28.00 indicates that the highest reported study time was 28 hours.
The mean of 16.42 means students studied an average of 16.42 hours per week.
The standard deviation of 4.86 describes the amount of variation in study hours around that mean.
At this stage, you are describing the sample. You are not testing a hypothesis or determining whether a relationship or group difference is statistically significant.
How to Get Frequencies and Percentages in SPSS
Use Frequencies when you need to describe categorical variables.
Suppose your dataset contains a study-status variable with two categories:
Full-time and Part-time.
Go to:
Analyze > Descriptive Statistics > Frequencies
Move Study Status into the Variable(s) box and click OK.
SPSS may produce a table similar to this:
| Study status | Frequency | Percent | Valid Percent |
|---|---|---|---|
| Full-time | 82 | 68.3 | 68.3 |
| Part-time | 38 | 31.7 | 31.7 |
| Total | 120 | 100.0 | 100.0 |
The Frequency column gives the number of cases in each category.
The Percent column calculates percentages using all cases, including cases that may have missing values for the variable.
The Valid Percent column calculates percentages using only cases with valid responses.
When missing values are present, this distinction becomes important. Check the number of valid and missing cases before selecting percentages for your results.
For categorical variables, a result such as 82 students (68.3%) were full-time students is usually more informative than calculating an average of the category codes.
How to Find the Median and Mode in SPSS
The Descriptives procedure does not provide the median or mode. If you need these statistics, one simple option is Frequencies.
Go to:
- Analyze > Descriptive Statistics > Frequencies
- Move your variable into the Variable(s) box and click Statistics.
- Select Median, Mode, or both. You can also select other statistics such as quartiles, percentiles, mean, standard deviation, minimum, maximum, range, skewness, and kurtosis.
- Click Continue, then click OK.
If your numerical variable contains many different values, SPSS may generate a very long frequency table. To avoid this, clear the Display frequency tables option before running the procedure.
You will still receive the requested summary statistics without producing a table containing every individual value.
The median can be particularly useful when numerical data are strongly skewed or contain extreme observations because it is less affected by unusually high or low values than the mean.
How to Use Explore for Descriptive Statistics in SPSS
Explore provides a more detailed examination of numerical variables than the basic Descriptives procedure.
It is particularly useful when you want to look beyond the mean and standard deviation.
Go to:
- Analyze > Descriptive Statistics > Explore
- Move the numerical variable into the Dependent List. If you simply want an overall description of the variable, you can leave the Factor List empty.
- Keep Display set to Both if you want SPSS to produce statistics and plots.
- Click Statistics and make sure Descriptives is selected.
- You can also open Plots to request useful graphical information about the distribution.
- Click Continue, then OK.
Explore can provide statistics such as:
Mean, median, standard deviation, variance, minimum, maximum, range, interquartile range, skewness, kurtosis, and a confidence interval for the mean.
It can also produce plots that help you understand the distribution and investigate unusual observations.
This makes Explore particularly useful when you are examining your data before conducting an inferential test.
How to Run Descriptive Statistics by Group in SPSS
Sometimes you do not want just one overall mean. You may want to describe a numerical variable separately for different groups.
Suppose you want to summarize academic stress for full-time and part-time students.
Go to:
- Analyze > Descriptive Statistics > Explore
- Move Academic Stress into the Dependent List.
- Move Study Status into the Factor List.
- Click OK.
SPSS will calculate descriptive statistics separately for the groups.
For example:
| Study status | N | Mean | Std. Deviation |
|---|---|---|---|
| Full-time | 78 | 3.74 | 0.69 |
| Part-time | 42 | 3.42 | 0.77 |
In this sample, full-time students have a higher average academic-stress score than part-time students.
However, this table alone does not tell us that the two populations differ statistically.
A difference between sample means is still descriptive. If your research question asks whether the difference is statistically significant, you would need an appropriate inferential test, such as an independent samples t test when its requirements are satisfied.
Descriptives vs. Frequencies vs. Explore
If you are unsure which SPSS option to choose, focus on what you need from the output.
| Procedure | Best for | Typical output |
|---|---|---|
| Descriptives | Quick summary of numerical variables | Mean, SD, minimum, maximum |
| Frequencies | Categorical variables and selected summary statistics | Counts, percentages, median, mode |
| Explore | Detailed examination of numerical variables | Descriptives, percentiles, distribution information, plots and group summaries |
You do not have to use the same procedure for every variable in your dataset.
A typical survey dataset may require Frequencies for demographic variables and Descriptives or Explore for numerical scores.
That is usually preferable to forcing every variable through a single procedure.
How to Run Descriptive Statistics Using SPSS Syntax
You do not have to use syntax to run descriptive statistics, but syntax can be helpful when you need to repeat an analysis or keep an exact record of what you did.
For example, the following syntax requests the mean, standard deviation, minimum, and maximum for three numerical variables:
DESCRIPTIVES VARIABLES=age stress_score satisfaction_score
  /STATISTICS=MEAN STDDEV MIN MAX.
For categorical variables, you could run:
FREQUENCIES VARIABLES=gender employment_status education_level
  /ORDER=ANALYSIS.
Using syntax can be particularly useful for dissertations or larger projects because the analysis can be rerun consistently if the data change.
Common Mistakes When Running Descriptive Statistics in SPSS
Several problems occur repeatedly when students first work with descriptive statistics.
- Using means for categorical codes. A numerical code does not automatically make a variable continuous. Codes such as 1 = Male and 2 = Female should normally be summarized with counts and percentages rather than a mean.
- Ignoring missing values. Always check the valid N. For frequency tables, pay attention to the difference between Percent and Valid Percent when missing responses are present.
- Reporting every statistic SPSS can produce. More output does not necessarily mean better analysis. Select statistics that actually help describe the variable and answer your research question.
- Treating descriptive differences as significant differences. Two groups can have different means without the difference being statistically significant. Descriptive statistics summarize the sample; inferential tests address statistical evidence about population differences or relationships.
- Ignoring unusual values. An extreme value can strongly affect the mean and standard deviation. If something looks unexpected, check the original data and consider using Explore or appropriate plots before continuing.
- Using the same procedure for every variable. Categorical and numerical variables often require different summaries. Choose the procedure based on the variable and the information you need.
What Should You Do After Running Descriptive Statistics?
Before moving to hypothesis testing, look carefully at your results.
Check whether the number of valid observations is what you expected. Look for minimum or maximum values that may indicate data-entry errors. Consider whether the mean and standard deviation provide a sensible summary of each numerical variable. For categorical variables, check frequencies, percentages, and missing responses.
If you are planning a t test, ANOVA, correlation, regression, or another statistical procedure, you may also need to examine assumptions relevant to that particular test.
Descriptive statistics are therefore not simply numbers to copy into a results section. They are an opportunity to understand your dataset before you make more complicated statistical decisions.
Ready to report your results? Learn how to present descriptive statistics correctly in your results section with our guide to reporting descriptive statistics in APA style.
Need Help With Your SPSS Data?
Knowing where to click in SPSS is only part of statistical analysis. You also need to know which statistics are appropriate for your variables and how to interpret the output correctly.
If you are working with your own assignment, dissertation, thesis, or research dataset and are unsure what to do next, you can hire an SPSS tutor through spss-tutors.com for private one-to-one guidance.
Your tutor can work through the analysis with you, explain the statistics behind the procedure, and help you understand your own SPSS output rather than simply giving you results.
Frequently Asked Questions
Where are descriptive statistics in SPSS?
Open Analyze > Descriptive Statistics. You can then select Descriptives, Frequencies, Explore, or another procedure depending on the type of information you need.
How do I get the mean and standard deviation in SPSS?
Go to Analyze > Descriptive Statistics > Descriptives. Move your numerical variable into the Variable(s) box and click OK. Mean and standard deviation are among the standard descriptive statistics available through this procedure.
How do I get frequencies and percentages in SPSS?
Go to Analyze > Descriptive Statistics > Frequencies, move the categorical variable into the Variable(s) box, and click OK. SPSS will display the number and percentage of cases in each category.
How do I find the median in SPSS?
Go to Analyze > Descriptive Statistics > Frequencies, click Statistics, select Median, and run the analysis. The median is also available through Explore.
How do I get descriptive statistics for different groups in SPSS?
Use Analyze > Descriptive Statistics > Explore. Put the numerical variable in the Dependent List and the categorical grouping variable in the Factor List. SPSS will produce separate descriptive statistics for the groups.
Should I use Descriptives or Frequencies in SPSS?
Use Descriptives when you need a quick numerical summary such as the mean, standard deviation, minimum, and maximum. Use Frequencies when you need counts and percentages for categorical variables or statistics such as the median and mode.
Can SPSS calculate descriptive statistics for several variables at once?
Yes. In Descriptives, move all the numerical variables you want to summarize into the Variable(s) box. SPSS will report descriptive statistics for each variable in the same output table.
Are descriptive statistics enough for a research study?
Descriptive statistics summarize the data you observed. If your research question asks whether groups differ, variables are related, or an effect exists in a wider population, you will usually need an appropriate inferential statistical test as well.