
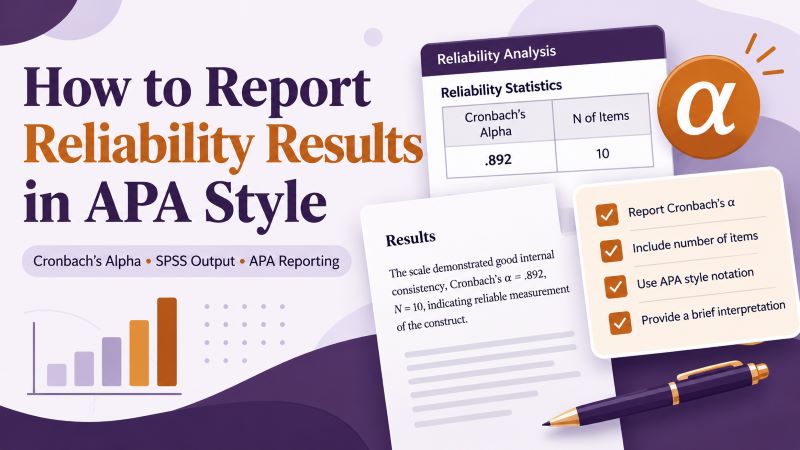
When reporting reliability results in APA style, begin by telling the reader what reliability analysis you conducted and what scale or set of items you assessed. You can then report the reliability coefficient and briefly interpret the result.
For example:
A reliability analysis was conducted to assess the internal consistency of the six-item Academic Confidence Scale. The scale demonstrated good internal consistency, Cronbach’s α = .82.
If you want to include the sample size, you can write:
A reliability analysis was conducted to assess the internal consistency of the six-item Academic Confidence Scale among 116 participants. The scale demonstrated good internal consistency, Cronbach’s α = .82.
This structure gives the reader the necessary context before presenting the coefficient.
For a straightforward scale, this may be all you need. More detailed reporting may be necessary when the reliability is low, the questionnaire contains several subscales, an item performs poorly, or you remove an item after reviewing the SPSS output.
This guide explains how to report Cronbach’s alpha and other important reliability results from SPSS in APA style.
If you have not yet conducted the analysis, start with our guide on How to Run a Reliability Test in SPSS.
What Should You Report for a Reliability Analysis?
A basic reliability write-up should usually tell the reader:
- what analysis you conducted;
- what scale or construct you assessed;
- how many items the scale contained;
- the reliability coefficient;
- what the coefficient suggests about internal consistency.
You may also report the sample size when it helps readers understand the analysis.
For example:
Cronbach’s alpha was used to assess the internal consistency of the eight-item Job Satisfaction Scale. The scale demonstrated good internal consistency, α = .86.
Another acceptable version is:
A reliability analysis using Cronbach’s alpha was conducted for the eight-item Job Satisfaction Scale. The results indicated good internal consistency, α = .86.
Both versions first explain what you did before presenting the result.
For many assignments, dissertations, and research reports, this level of detail is sufficient when the scale performs as expected.
You may need additional information if you:
- identify a weak item;
- remove an item;
- compare several subscales;
- report low reliability;
- develop or modify a scale;
- examine corrected item-total correlations.
APA Template for Reporting Cronbach’s Alpha
A useful general template is:
A reliability analysis using Cronbach’s alpha was conducted to assess the internal consistency of the [NUMBER]-item [SCALE NAME]. The scale demonstrated [INTERPRETATION] internal consistency, α = [ALPHA].
For example:
A reliability analysis using Cronbach’s alpha was conducted to assess the internal consistency of the six-item Academic Confidence Scale. The scale demonstrated good internal consistency, α = .82.
If sample size matters, use:
A reliability analysis using Cronbach’s alpha was conducted to assess the internal consistency of the [NUMBER]-item [SCALE NAME] among [SAMPLE SIZE] participants. The scale demonstrated [INTERPRETATION] internal consistency, α = [ALPHA].
Example:
A reliability analysis using Cronbach’s alpha was conducted to assess the internal consistency of the six-item Academic Confidence Scale among 116 participants. The scale demonstrated good internal consistency, α = .82.
You can also use a more concise form:
Internal consistency of the six-item Academic Confidence Scale was assessed using Cronbach’s alpha. The scale showed good reliability, α = .82.
The key point is that the reader should know what you assessed before you state the coefficient.
How to Format Cronbach’s Alpha in APA Style
Cronbach’s alpha uses the Greek letter α
A correct APA-style expression is: α = .82. You may introduce it as: Cronbach’s α = .82
Do not report it as:
Cronbach Alpha = 0.82
or:
Cronbach’s Alpha = 82%
Cronbach’s alpha is a coefficient rather than a percentage.
Because alpha cannot exceed 1, APA-style statistical reporting omits the leading zero.
Write:
α = .82
rather than:
α = 0.82
Two decimal places are usually enough for narrative reporting.
If SPSS gives:
.823
you may report:
α = .82
If you choose to report three decimal places, use the same level of precision for the other reliability coefficients in the same study.
Should Cronbach’s Alpha Be Italicized?
No.
The Greek letter α is not italicized in APA statistical notation.
Write:
Cronbach’s α = .82
The alpha symbol remains in regular type.
This differs from many statistical symbols that use Latin letters. For example:
- N is italicized;
- n is italicized;
- r is italicized;
- p is italicized.
Therefore, a correctly formatted sentence could read:
A reliability analysis was conducted for the six-item Academic Confidence Scale using data from N = 116 participants. The scale demonstrated good internal consistency, Cronbach’s α = .82.
Only N is italicized in the first sentence, while α remains in regular type.
How to Turn SPSS Reliability Output Into APA Style
Suppose you ran a reliability analysis for a six-item Academic Confidence Scale.
The SPSS Reliability Statistics table shows:
| Cronbach’s Alpha | N of Items |
|---|---|
| .823 | 6 |
The Case Processing Summary shows:
| Cases | N |
|---|---|
| Valid | 116 |
| Excluded | 4 |
| Total | 120 |
A strong APA-style write-up would be:
A reliability analysis using Cronbach’s alpha was conducted to assess the internal consistency of the six-item Academic Confidence Scale. The analysis included 116 participants with complete data, and the scale demonstrated good internal consistency, α = .82.
This is more useful than pasting the SPSS tables into the Results section.
It tells the reader:
- what analysis you conducted;
- what you assessed;
- how many cases contributed to the analysis;
- what reliability coefficient you obtained;
- how you interpreted the coefficient.
If the sample size has already been explained elsewhere and no cases were unexpectedly excluded, you can shorten the report:
A reliability analysis using Cronbach’s alpha was conducted for the six-item Academic Confidence Scale. The scale demonstrated good internal consistency, α = .82.
How to Interpret Cronbach’s Alpha Before Reporting It
Researchers often use the following values as general guidelines:
| Cronbach’s α | Common interpretation |
|---|---|
| Below .60 | Low |
| .60–.69 | Questionable |
| .70–.79 | Acceptable |
| .80–.89 | Good |
| .90 and above | Very high |
These values are guidelines rather than universal cutoffs.
Reliability can depend on:
- the purpose of the scale;
- the number of items;
- the population;
- the research context;
- whether the scale is established or newly developed.
For example, α = .68 does not automatically mean that a scale must be discarded.
Similarly, α = .96 does not automatically mean that the scale is ideal. An extremely high coefficient can sometimes indicate that several items are very similar.
Use cautious wording that reflects the evidence.
Instead of writing:
The scale had perfect reliability.
write:
A reliability analysis was conducted for the 10-item scale. The scale demonstrated high internal consistency, α = .93.
How to Report Acceptable Reliability
Suppose a five-item Perceived Support Scale produces:
α = .76
You could report:
A reliability analysis using Cronbach’s alpha was conducted to assess the internal consistency of the five-item Perceived Support Scale. The scale demonstrated acceptable internal consistency, α = .76.
If you want to include sample size:
A reliability analysis using Cronbach’s alpha was conducted for the five-item Perceived Support Scale among 204 participants. The scale demonstrated acceptable internal consistency, α = .76.
The first sentence tells the reader what you did, while the second gives the result.
How to Report Good Reliability
Suppose an eight-item Job Satisfaction Scale produces:
α = .86
You could write:
A reliability analysis using Cronbach’s alpha was conducted to assess the internal consistency of the eight-item Job Satisfaction Scale. The scale demonstrated good internal consistency, α = .86.
For a higher coefficient:
Cronbach’s alpha was used to assess the internal consistency of the 10-item Organizational Commitment Scale. The scale demonstrated high internal consistency, α = .93.
Avoid unnecessarily complicated wording.
You do not need to write:
A Cronbach’s alpha reliability analysis was undertaken in order to determine whether the items contained within the scale demonstrated an adequate level of internal consistency reliability.
A simpler sentence communicates the same idea more clearly.
How to Report Low Reliability
Low reliability requires more explanation because the reader needs to know whether you investigated the result.
Suppose a six-item Academic Motivation Scale produces:
α = .61
You could write:
A reliability analysis using Cronbach’s alpha was conducted to assess the internal consistency of the six-item Academic Motivation Scale. The scale demonstrated relatively low internal consistency, α = .61.
If you also examined the items, continue with the relevant findings:
Corrected item-total correlations ranged from .18 to .54, with Item 4 showing the weakest relationship with the remaining items.
A complete write-up could therefore read:
A reliability analysis using Cronbach’s alpha was conducted to assess the internal consistency of the six-item Academic Motivation Scale. The scale demonstrated relatively low internal consistency, α = .61. Corrected item-total correlations ranged from .18 to .54, with Item 4 showing the lowest corrected item-total correlation.
This gives the reader more useful information than simply reporting that alpha was low.
How to Report Corrected Item-Total Correlations
Corrected item-total correlations show how strongly each item relates to the total score formed from the remaining items.
You do not need to report these values for every routine reliability analysis.
They become particularly useful when:
- reliability is low;
- one item appears problematic;
- you are developing or modifying a scale;
- item analysis is part of your research question;
- your supervisor requests more detail.
Suppose corrected item-total correlations range from:
.41 to .68
You could write:
A reliability analysis was conducted for the six-item scale. The scale demonstrated good internal consistency, α = .84, and corrected item-total correlations ranged from .41 to .68.
If one item performs poorly:
A reliability analysis was conducted for the six-item scale. The initial reliability coefficient was α = .64. Corrected item-total correlations ranged from .14 to .67, with Item 3 showing the lowest corrected item-total correlation (.14).
The item-level statistic should support the explanation rather than become a list of every value produced by SPSS.
How to Report Cronbach’s Alpha if Item Deleted
SPSS also reports Cronbach’s Alpha if Item Deleted.
This column estimates what the overall alpha would become if you removed a specific item.
Suppose the initial scale produces:
α = .68
and deleting Item 5 would increase reliability to:
α = .77
If you retain the item, you might write:
A reliability analysis was conducted for the six-item scale, which produced Cronbach’s α = .68. Although removing Item 5 would increase alpha to .77, the item was retained because it represented an important aspect of the construct.
If you remove the item after reviewing the statistical and theoretical evidence, explain the complete process:
An initial reliability analysis was conducted for the six-item scale and produced Cronbach’s α = .68. Item 5 had a low corrected item-total correlation (.16), and removing the item increased alpha to .77. After reviewing the item wording and its relationship with the intended construct, Item 5 was removed. A second reliability analysis showed that the final five-item scale demonstrated acceptable internal consistency, α = .77.
This wording allows the reader to follow the analytical decision.
Do not report only:
Cronbach’s α = .77.
if you reached that value by removing an item during the analysis.
How to Report Reliability After Reverse Coding an Item
A negatively worded item may require reverse coding before you run the reliability analysis.
If reverse coding forms part of your data preparation, you usually do not need to discuss it extensively in the reliability result unless it is important to understanding the analysis.
For example:
Negatively worded items were reverse-coded before the reliability analysis. Cronbach’s alpha was then used to assess the internal consistency of the six-item Academic Confidence Scale. The scale demonstrated good internal consistency, α = .82.
If you need help with reverse scoring and running the analysis, see our How to Run a Reliability Test in SPSS guide.
How to Report Reliability for Multiple Subscales
Many questionnaires contain several subscales that measure different constructs.
Suppose a workplace questionnaire contains:
- six Job Satisfaction items;
- five Organizational Support items;
- seven Work Stress items.
You should report the reliability of each scale separately.
For example:
Separate reliability analyses using Cronbach’s alpha were conducted for the three study scales. The six-item Job Satisfaction Scale demonstrated good internal consistency (α = .84), the five-item Organizational Support Scale demonstrated acceptable internal consistency (α = .79), and the seven-item Work Stress Scale demonstrated good internal consistency (α = .87).
This opening sentence tells the reader exactly what you did.
You can also shorten the result when a table contains the details:
Reliability analyses were conducted for all three study scales. Cronbach’s alpha values ranged from .79 to .87, indicating acceptable to good internal consistency.
How to Report Reliability in an APA Table
A table works well when your study contains several scales or subscales.
For example:
Table 1
Internal Consistency of the Study Scales
| Scale | Number of Items | N | Cronbach’s α |
|---|---|---|---|
| Academic Confidence | 6 | 116 | .82 |
| Academic Stress | 5 | 116 | .85 |
| Study Satisfaction | 7 | 116 | .79 |
| Perceived Support | 6 | 116 | .88 |
Introduce the table by explaining what you did:
Reliability analyses using Cronbach’s alpha were conducted for the four study scales. As shown in Table 1, alpha values ranged from .79 to .88, indicating acceptable to good internal consistency across the measures.
This is better than beginning with:
Table 1 shows the results.
The reader should understand the purpose of the analysis before being directed to the table.
Do not repeat every coefficient in the text when the table already presents the values clearly.
Complete APA Reliability Results Example
Suppose a researcher has a six-item Academic Confidence Scale.
The original dataset contains 120 participants, but four participants have incomplete responses on one or more scale items. SPSS therefore uses 116 complete cases.
The output gives:
Cronbach’s α = .823
Corrected item-total correlations range from:
.49 to .68
Removing any item would either reduce alpha or produce no meaningful improvement.
A complete APA-style result could read:
A reliability analysis using Cronbach’s alpha was conducted to assess the internal consistency of the six-item Academic Confidence Scale. The analysis included 116 participants with complete item data. The scale demonstrated good internal consistency, α = .82, and corrected item-total correlations ranged from .49 to .68. Removing any individual item did not meaningfully improve the reliability coefficient, so all six items were retained for the final scale.
This write-up gives the reader a clear sequence:
what was done → who was included → overall reliability → item-level evidence → final decision
If the assignment only requires the overall reliability coefficient, a shorter version is enough:
A reliability analysis using Cronbach’s alpha was conducted for the six-item Academic Confidence Scale. The scale demonstrated good internal consistency, α = .82.
How to Report Reliability for Several Scales in a Dissertation
A dissertation may use several questionnaires or several subscales from one questionnaire.
Suppose your study includes:
- Hygiene Scale: 8 items;
- Motivation Scale: 6 items;
- Leadership Scale: 5 items.
A concise results paragraph could read:
Reliability analyses using Cronbach’s alpha were conducted to assess the internal consistency of the three study scales. The eight-item Hygiene Scale demonstrated good internal consistency, α = .82. The six-item Motivation Scale also demonstrated good internal consistency, α = .81, while the five-item Leadership Scale showed acceptable internal consistency, α = .78.
If the dissertation contains many scales, a table will usually present the information more clearly.
Students who need help connecting reliability analysis with the wider dissertation analysis can also see our SPSS Dissertation Help tutoring service.
Should You Report Reliability From Your Own Sample?
Yes.
When you use a multi-item scale in your own research, the reliability estimate from your sample tells readers how consistently the items performed with your participants.
Suppose the original scale-development study reported:
α = .88
while your sample produces:
α = .74
You should not report only the original coefficient.
You could write:
Cronbach’s alpha was used to assess the internal consistency of the Academic Confidence Scale in the current sample. The scale demonstrated acceptable internal consistency, α = .74. This coefficient was lower than the α = .88 reported in the original validation study.
This clearly distinguishes your reliability result from the published value.
Where Should You Report Reliability in a Dissertation or Research Paper?
The best location depends on your university, journal, and purpose of the analysis.
Researchers often mention the reliability of an established scale when describing the measure in the Method section.
If reliability analysis forms part of the current study, especially when you examine item performance or modify a scale, you may report the results in the Results section.
A dissertation may also include a dedicated reliability subsection before the main hypothesis tests.
Whichever structure you use, first tell readers what analysis you conducted and then present the reliability evidence.
Avoid reporting the same alpha repeatedly in several sections unless each mention serves a clear purpose.
Reliability Does Not Prove Validity
Do not write:
Cronbach’s alpha was .85, which confirmed that the questionnaire was valid.
Cronbach’s alpha assesses internal consistency. It does not establish validity.
A correct statement would be:
A reliability analysis using Cronbach’s alpha was conducted for the questionnaire. The scale demonstrated good internal consistency, α = .85.
If your study also examines validity or dimensionality, report that evidence separately.
Similarly, a high alpha does not prove that every item measures one single underlying dimension.
Common Mistakes When Reporting Reliability Results
- Reporting the coefficient without saying what was done. Introduce the analysis before presenting alpha.
- Writing alpha as a percentage. Report α = .82 rather than 82%.
- Using a leading zero. Write α = .82 rather than α = 0.82.
- Italicizing α. The Greek alpha symbol remains in regular type.
- Reporting only that reliability was good. Always provide the coefficient.
- Copying the SPSS Reliability Statistics table. Convert the relevant values into a clear APA-style sentence or table.
- Reporting one alpha for unrelated subscales. Assess separate constructs separately.
- Deleting items only to increase alpha. Use theoretical and statistical evidence when deciding whether to remove an item.
- Reporting the final alpha without explaining item deletion. Tell the reader when the scale changed during your analysis.
- Claiming alpha proves validity.
Internal consistency and validity are different measurement properties. - Reporting only reliability from the original scale publication. Report the reliability estimate from your own sample when possible.
APA Reliability Reporting Checklist
Before finalizing your reliability section, confirm that:
- you explained what reliability analysis you conducted;
- you identified the scale or subscale;
- you stated the number of items where useful;
- you reported Cronbach’s α;
- you omitted the leading zero;
- you kept α in regular type;
- you used N or n correctly when reporting sample size;
- you interpreted the coefficient cautiously;
- you reported separate reliability estimates for separate subscales;
- you explained any item removal;
- you included item-total statistics only when they added useful information;
- you distinguished reliability from validity;
- you converted SPSS output into clear academic reporting.
Need Help Reporting Your SPSS Reliability Results?
If you have already run the analysis but are unsure which SPSS values belong in your Results section, one-to-one tutoring can help you work through the output.
SPSS-tutors.com provides private tutoring for questionnaire reliability, reverse coding, Cronbach’s alpha, item-total statistics, scale construction, and APA-style reporting.
If you have not yet completed the analysis, start with How to Run a Reliability Test in SPSS.
Students using reliability analysis as part of a thesis or dissertation can also learn more about SPSS Dissertation Help through one-to-one online tutoring.
Frequently Asked Questions
How do you report Cronbach’s alpha in APA style?
First explain what analysis you conducted and what scale you assessed.
For example:
A reliability analysis using Cronbach’s alpha was conducted for the six-item Academic Confidence Scale. The scale demonstrated good internal consistency, α = .82.
Should I say what reliability test I used?
Yes.
The reader should know what analysis produced the reliability coefficient.
For example:
Cronbach’s alpha was used to assess the internal consistency of the six-item scale.
You can then report the coefficient and interpretation.
Do you italicize Cronbach’s alpha?
No.
The Greek letter α remains in regular type.
Latin statistical symbols such as N, n, r, and p normally appear in italics.
Should I write 0.82 or .82?
Write:
α = .82
APA-style statistical reporting omits the leading zero for coefficients that cannot exceed 1.
How many decimal places should I report for Cronbach’s alpha?
Two decimal places are usually sufficient for narrative reporting.
For example, you can report an SPSS value of .823 as:
α = .82
Keep the precision consistent across scales.
Do I need to report the number of items?
The number of items gives useful context and is often worth reporting.
For example:
A reliability analysis was conducted for the eight-item scale, which demonstrated good internal consistency, α = .86.
Do I need to report corrected item-total correlations?
Not for every reliability analysis.
Include them when reliability is weak, an item appears problematic, you modify the scale, or item analysis forms part of your research question.
How do I report reliability after deleting an item?
Report both the initial reliability result and the reason for removing the item before giving the final coefficient.
For example:
The initial six-item scale produced α = .68. Item 5 showed a low corrected item-total correlation, and removing it increased alpha to .77. The final five-item scale therefore demonstrated acceptable internal consistency, α = .77.
How do I report reliability for several subscales?
State that separate reliability analyses were conducted and report alpha for each subscale.
For example:
Separate reliability analyses were conducted for the three subscales. Cronbach’s alpha was .84 for Job Satisfaction, .79 for Organizational Support, and .87 for Work Stress.
Can I say the questionnaire was valid because alpha was high?
No.
Cronbach’s alpha provides evidence about internal consistency. It does not establish validity.
Should I copy the SPSS reliability table into my dissertation?
Usually, no.
Report the key reliability results in APA-style prose or create your own concise table when you have several scales.
If you still need to conduct the analysis, see How to Run a Reliability Test in SPSS.