
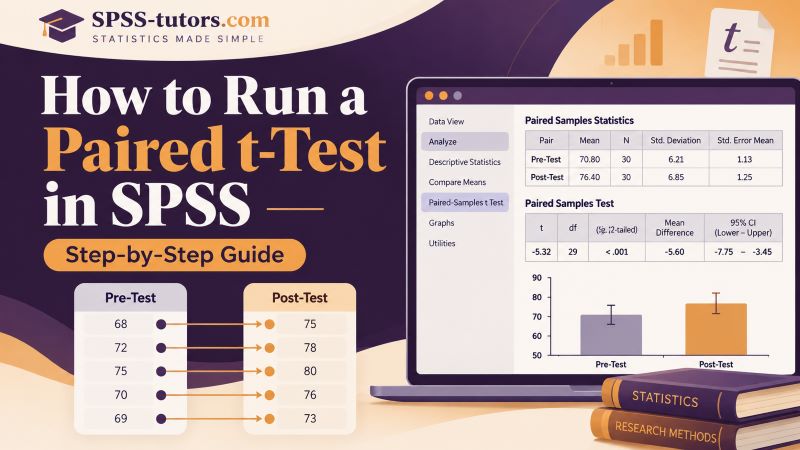
A paired t-test in SPSS compares two related measurements to determine whether their mean difference is statistically significant.
You will often use this test when the same participants are measured twice, such as before and after an intervention. You can also use it when observations form meaningful matched pairs.
To run a paired t-test in SPSS, go to Analyze > Compare Means > Paired-Samples T Test, select the two related variables, move them into the Paired Variables box, and click OK.
SPSS will produce descriptive statistics for both measurements and a Paired Samples Test table containing the mean difference, t statistic, degrees of freedom, p value, and confidence interval.
The steps are simple once the data are set up correctly. The more important part is understanding what SPSS is comparing and how to interpret the output.
This guide walks through the complete process using a pre-test and post-test example.
When Should You Use a Paired t-Test?
Use a paired t-test when you have two related numerical measurements.
The most common design measures the same participants twice.
Examples include:
- exam scores before and after tutoring;
- blood pressure before and after treatment;
- anxiety scores before and after therapy;
- employee productivity before and after training;
- satisfaction scores before and after a service change;
- measurements under two different experimental conditions.
A paired t-test can also compare observations from matched individuals. For example, a researcher might deliberately match participants by age or another characteristic and compare the outcome within each matched pair.
The key idea is that the two observations are not independent of each other.
If Student 1 provides a pre-test score, the corresponding post-test score must also belong to Student 1.
Paired t-Test vs. Independent t-Test
Students often confuse paired and independent t-tests because both compare two means.
The study design determines which test you need.
| Research situation | Appropriate test |
|---|---|
| Same students measured before and after training | Paired t-test |
| Same patients measured before and after treatment | Paired t-test |
| Same participants complete two conditions | Paired t-test |
| Two matched observations form each pair | Paired t-test |
| Treatment group compared with a separate control group | Independent-samples t-test |
| Male participants compared with different female participants | Independent-samples t-test |
| One sample mean compared with a fixed benchmark | One-sample t-test |
If each participant contributes both scores, the design is usually paired. However, if the two means come from completely separate groups of people, you normally need an independent-samples t-test.
Want to compare one sample mean with a fixed value? See our guide on how to Run a One-Sample t Test in SPSS.
Example Used in This Guide
Suppose a university introduces a short study-skills program.
Thirty students complete the same test before the program and again after completing it.
The research question is:
Do students’ mean test scores differ before and after the study-skills program?
The two variables are:
Pre_Test — score before the program
Post_Test — score after the program
The descriptive statistics are:
| Measurement | N | Mean | Standard Deviation |
|---|---|---|---|
| Pre-test | 30 | 62.30 | 8.10 |
| Post-test | 30 | 66.90 | 7.50 |
The post-test mean is 4.60 points higher than the pre-test mean.
However, the difference between the two sample means alone does not tell us whether there is sufficient statistical evidence of a population-level change.
That is what the paired t-test evaluates.
For a two-sided test, the hypotheses are:
H₀: μdiff = 0
H₁: μdiff ≠ 0
The null hypothesis states that the population mean difference between the paired measurements is zero.
How Should Paired Data Be Arranged in SPSS?
Data setup is important for a paired t-test.
Each participant should occupy one row, while the two measurements should appear in two separate columns.
For example:
| ID | Pre_Test | Post_Test |
|---|---|---|
| 1 | 58 | 64 |
| 2 | 67 | 70 |
| 3 | 61 | 65 |
| 4 | 55 | 63 |
| 5 | 70 | 73 |
Student 1’s pre-test and post-test scores appear on the same row. The same arrangement continues for every participant.
Do not create one column containing all scores and another column containing labels such as Pre and Post if you want to use the standard Paired-Samples T Test dialog directly.
The paired procedure expects the two measurements as separate variables.
Also make sure both variables contain numerical scores rather than category labels or text.
Assumptions of a Paired t-Test
Before running the test, check whether the paired t-test suits your data.
The Dependent Variable Should Be Numerical
Both measurements should represent the same numerical outcome.
Examples include:
- test scores;
- blood pressure;
- reaction time;
- weight;
- scale scores;
- productivity measures.
A paired t-test is not appropriate for two categorical outcomes.
The Measurements Must Be Paired
Every observation in one variable should have a meaningful partner in the second variable.
For a pre-test/post-test design, both measurements should come from the same participant.
Different Pairs Should Be Independent
The two observations within each pair are related, but one participant’s pair should not depend on another participant’s pair.
For example, Student 1’s two scores form one pair and Student 2’s two scores form another pair.
Check for Serious Outliers in the Difference Scores
A paired t-test works with the difference between the two measurements.
Extreme differences can have a strong influence on the mean difference and the t statistic.
For that reason, examine the difference scores for serious outliers.
The Difference Scores Should Be Approximately Normal
This assumption is frequently misunderstood.
You do not need each of the two original variables to have a perfectly normal distribution.
The relevant assumption concerns the distribution of:
Variable 1 − Variable 2
In our example, that means examining:
Pre_Test − Post_Test
This distinction is important because the paired t-test directly analyzes the differences between the paired observations.
How to Check the Difference Scores in SPSS
If you want to examine the normality assumption carefully, first create a difference variable.
Go to:
Transform > Compute Variable
Enter a new variable name, such as:
Difference
In the Numeric Expression box, enter:
Pre_Test – Post_Test
Click OK.
SPSS will create a new column containing the difference for every participant.
You can then inspect that variable using:
Analyze > Descriptive Statistics > Explore
Move Difference into the Dependent List.
From the Plots options, you can examine a histogram and normal Q-Q plot.
Focus on the overall shape and any serious outliers rather than expecting the data to look perfectly normal.
If you want to review descriptive statistics before running the t-test, see How to Run Descriptive Statistics in SPSS.
How to Run a Paired t-Test in SPSS
Once your data are ready, the test takes only a few steps.
Step 1: Open the Paired-Samples T Test Dialog
From the SPSS menu, select:
Analyze > Compare Means > Paired-Samples T Test
Some SPSS versions may label the broader menu Compare Means and Proportions, but the procedure is still called Paired-Samples T Test.
The dialog box will show your variables on the left.
Step 2: Select the Two Related Variables
Select:
Pre_Test
and:
Post_Test
Move them into the Paired Variables area.
SPSS should show them as one pair.
For example:
Pair 1: Pre_Test — Post_Test
Make sure the two variables that belong together appear on the same pair row.
Step 3: Pay Attention to the Variable Order
The order matters because SPSS calculates the difference as:
Variable 1 − Variable 2
If you enter:
Pre_Test first
and:
Post_Test second
SPSS calculates:
Pre_Test − Post_Test
Because the post-test mean in our example is higher, the mean difference will be negative:
62.30 − 66.90 = −4.60
This negative result does not mean that anything went wrong.
It simply reflects the order of subtraction.
If you reverse the variables and enter Post_Test first, the difference becomes positive:
66.90 − 62.30 = 4.60
The statistical conclusion remains the same, but the signs of the mean difference and t statistic change.
Step 4: Review the Options
Click Options if you want to inspect or change the confidence interval.
SPSS commonly uses a:
95% confidence interval
For most standard analyses using α = .05, you can leave this setting unchanged.
Depending on your SPSS version, you may also have an option to estimate t-test effect sizes.
Select it if you want SPSS to provide an effect-size estimate.
Step 5: Click OK
Click OK to run the test.
SPSS will send the results to the Output Viewer.
You will normally see:
- Paired Samples Statistics
- Paired Samples Correlations
- Paired Samples Test
Some versions may also display an effect-size table if you requested it.
How to Interpret the Paired Samples Statistics Table
Start with the Paired Samples Statistics table.
For our example:
| Measurement | Mean | N | Std. Deviation | Std. Error Mean |
|---|---|---|---|---|
| Pre_Test | 62.30 | 30 | 8.10 | 1.48 |
| Post_Test | 66.90 | 30 | 7.50 | 1.37 |
This table provides the descriptive statistics for the two measurements.
The pre-test mean is:
62.30
The post-test mean is:
66.90
The observed increase is:
66.90 − 62.30 = 4.60 points
At this stage, you can describe what happened in the sample.
Students scored higher after the program.
However, you cannot yet conclude that the change is statistically significant. For that, you need the Paired Samples Test table.
How to Interpret the Paired Samples Correlations Table
SPSS also produces a Paired Samples Correlations table.
Suppose the output shows:
| Pair | N | Correlation | Significance |
|---|---|---|---|
| Pre_Test & Post_Test | 30 | .62 | < .001 |
This means that students with relatively high pre-test scores also tended to have relatively high post-test scores.
However, this correlation is not the paired t-test result.
A common beginner mistake is to look at the significance value in the Paired Samples Correlations table and use it to decide whether the pre-test and post-test means differ.
Do not do that.
The correlation asks whether the two sets of scores are related.
The paired t-test asks whether their mean difference differs from zero.
Those are different questions.
For statistical significance of the mean change, use the Paired Samples Test table.
How to Interpret the Paired Samples Test Table
This is the most important table for the hypothesis test.
Suppose SPSS produces:
| Statistic | Result |
|---|---|
| Mean difference | -4.60 |
| SD of difference | 6.80 |
| SE of difference | 1.24 |
| 95% CI | [-7.14, -2.06] |
| t | -3.71 |
| df | 29 |
| Two-sided p | .001 |
Let’s interpret each part.
Mean Difference
SPSS reports:
Mean Difference = −4.60
Remember that we entered:
Pre_Test − Post_Test
Therefore:
62.30 − 66.90 = −4.60
The negative sign tells us that the first measurement was lower than the second measurement.
In plain language:
Post-test scores were 4.60 points higher on average than pre-test scores.
The sign is not a measure of statistical significance. It only indicates direction based on the order of the variables.
Standard Deviation of the Differences
SPSS reports:
SD difference = 6.80
This value describes how much the individual change scores vary around the average change.
Some students may have improved much more than 4.60 points, while others may have improved less or even declined.
The standard deviation summarizes that variability.
Standard Error of the Mean Difference
The standard error in our example is approximately:
SE = 1.24
SPSS uses this value when calculating the t statistic.
Conceptually:
t = Mean difference / Standard error of the difference
For our example:
t = -4.60 / 1.24 ≈ -3.71
t Statistic
The t statistic is:
t = −3.71
The negative sign follows from the variable order.
Since SPSS calculated:
Pre_Test − Post_Test
and the post-test scores were higher, the difference and t statistic are negative.
If you had entered Post_Test first, the t statistic would have the same magnitude but a positive sign.
Degrees of Freedom
SPSS reports:
df = 29
For a paired t-test:
df = number of complete pairs − 1
We have 30 complete pairs:
30 − 1 = 29
Notice that the calculation uses the number of pairs, not 60 observations.
Each participant contributes one paired difference.
p Value
For our example:
p = .001
Using α = .05:
.001 < .05
The result is statistically significant.
We therefore reject the null hypothesis that the population mean difference equals zero.
The sample provides evidence that mean scores differed between the pre-test and post-test measurements.
Because the post-test mean is higher than the pre-test mean, the observed change is in the direction of improvement.
How to Interpret the 95% Confidence Interval
SPSS reports:
95% CI [-7.14, -2.06]
This interval is for the mean paired difference, not for either individual mean.
Remember that SPSS calculated:
Pre_Test − Post_Test
Therefore, the negative interval means that the pre-test score is estimated to be between approximately 2.06 and 7.14 points lower than the post-test score.
Another important point is that the interval does not include zero.
For a conventional two-sided paired t-test at α = .05, that agrees with the statistically significant p value.
If the confidence interval had been:
[-3.10, 1.25]
it would contain zero. That would normally correspond to a nonsignificant two-sided result at the .05 level.
One-Sided vs. Two-Sided p Values
Some recent SPSS versions may display both:
One-Sided p
and:
Two-Sided p
Use the p value that matches the hypothesis you specified before examining the data.
For a question such as:
Do test scores differ before and after the intervention?
the hypothesis allows change in either direction, so use the two-sided p value.
A directional hypothesis might instead state:
Post-test scores will be higher than pre-test scores.
A one-sided test can be appropriate when you clearly justify and specify that direction before looking at the results.
Do not choose a one-sided p value after seeing that it gives a smaller number.
Effect Size for a Paired t-Test
Statistical significance tells you whether there is evidence of a change, but it does not tell you how large that change is.
An effect size helps describe the magnitude of the difference.
For paired data, one common effect-size measure is Cohen’s d based on the difference scores:
d = Mean difference / SD of the differences
Using the values in our example:
d = -4.60 / 6.80 ≈ -0.68
The sign reflects the order of subtraction.
For interpreting the magnitude, you would normally focus on:
|d| = 0.68
Common reference values are:
| Cohen’s d | Conventional interpretation |
|---|---|
| 0.20 | Small |
| 0.50 | Medium |
| 0.80 | Large |
Using those general guidelines, a magnitude of 0.68 represents a moderate-to-large standardized change.
Treat these values as rough reference points rather than universal rules. Practical importance depends on the research context.
Some SPSS versions can calculate t-test effect sizes automatically.
Complete Interpretation of the Example
Our paired t-test produced:
| Statistic | Result |
|---|---|
| Pre-test mean | 62.30 |
| Pre-test SD | 8.10 |
| Post-test mean | 66.90 |
| Post-test SD | 7.50 |
| Mean difference, Pre − Post | -4.60 |
| t | -3.71 |
| df | 29 |
| Two-sided p | .001 |
| 95% CI of difference | [-7.14, -2.06] |
| Cohen’s d | -0.68 |
The students scored an average of 62.30 before the study-skills program and 66.90 afterward.
Post-test scores were therefore 4.60 points higher on average.
Because SPSS calculated Pre_Test minus Post_Test, the mean difference appears as −4.60 and the t statistic appears as −3.71.
The two-sided p value of .001 is below .05, so the mean difference is statistically significant.
The confidence interval does not contain zero, which supports the same conclusion.
The effect-size magnitude of approximately 0.68 suggests that the change was moderate to large under commonly used reference values.
What if the Paired t-Test Is Not Significant?
Suppose a different study produces:
Pre-test M = 62.30
Post-test M = 63.10
and:
t(29) = −0.74, p = .465
Since:
.465 > .05
the result is not statistically significant at α = .05.
You would fail to reject the null hypothesis.
A correct conclusion might be:
The analysis did not provide sufficient evidence that the population mean scores differed between the two measurements.
Do not write:
There was no difference.
The sample means may still differ numerically.
A nonsignificant test tells you that the available data do not provide sufficient statistical evidence of a population mean difference at the chosen significance level.
What Happens if Some Participants Have Missing Data?
A paired t-test requires both measurements for each included pair.
Suppose you have 40 participants, but three participants are missing their post-test scores.
Those three participants cannot contribute a complete pre/post difference.
SPSS will therefore use the complete pairs available for that test.
Always check the N in the Paired Samples Statistics table.
Do not assume that the test used every row in your dataset.
Missing pairs also affect the degrees of freedom because:
df = number of complete pairs − 1
If SPSS reports a smaller N than expected, investigate missing values or filters before interpreting the analysis.
Do You Need Levene’s Test for a Paired t-Test?
No.
Levene’s test checks equality of variance between independent groups.
A paired t-test does not compare two independent groups, so the equal-variances assumption does not apply in the same way.
You therefore should not look for an “equal variances assumed” row in paired t-test output.
Instead, focus on the distribution of the paired difference scores.
This is one important difference between paired and independent t-tests.
How to Run a Paired t-Test Using SPSS Syntax
You can also run the analysis using SPSS syntax.
For variables named Pre_Test and Post_Test, use:
T-TEST PAIRS=Pre_Test WITH Post_Test (PAIRED)
  /CRITERIA=CI(.95).
This tells SPSS to compare Pre_Test with Post_Test as a paired set and calculate a 95% confidence interval for the mean difference.
Syntax is useful when you need to reproduce your analysis later.
It can be especially helpful for dissertations, research projects, or assignments involving several statistical procedures.
Common Mistakes When Running a Paired t-Test in SPSS
Several errors occur frequently when students first use the paired t-test.
- Using an independent-samples t-test for repeated measurements. If the same people provide both scores, the observations are paired rather than independent.
- Putting the data in the wrong format. Each participant should normally occupy one row, with the two measurements in separate columns.
- Pairing the wrong variables. Check that both measurements represent the same outcome and correspond correctly.
- Ignoring the order of the variables. SPSS calculates Variable 1 minus Variable 2, so the order determines the sign of the mean difference and t statistic.
- Checking normality of the wrong variable. The normality assumption applies to the paired difference scores.
- Using the correlation p value as the t-test result. The Paired Samples Correlations table tests a different question.
- Looking only at the p value. Also examine the means, mean difference, confidence interval, and effect size.
- Assuming a negative t statistic means the result is bad. The sign usually reflects the direction of subtraction.
- Looking for Levene’s test. The paired t-test does not require the equal-variances assumption used for independent groups.
- Ignoring missing pairs. Check the number of complete cases included in the analysis.
- Saying a nonsignificant test proves there is no difference. A nonsignificant result means the available evidence was insufficient to establish a population mean difference.
Paired t-Test SPSS Checklist
Before you finalize the analysis, confirm that:
- both variables are numerical;
- the measurements are genuinely paired;
- each row contains the two scores for the correct participant;
- different pairs are independent;
- you examined serious outliers in the difference scores;
- you considered the distribution of the paired differences;
- you selected the correct two variables in SPSS;
- you paid attention to Variable 1 minus Variable 2;
- the N in the output matches the number of complete pairs;
- you reviewed the means and standard deviations;
- you used the Paired Samples Test table for the hypothesis test;
- you identified the correct p value;
- you interpreted the mean difference in the correct direction;
- you checked whether the confidence interval includes zero;
- you considered an effect size where appropriate.
How Do You Report a Paired t-Test in APA Style?
Running the test is only the first step. You also need to present the result clearly.
For our example, an APA-style result might look similar to:
Post-test scores were higher than pre-test scores following the study-skills program, with the paired analysis showing a statistically significant mean change.
A formal report would also include the means, standard deviations, t statistic, degrees of freedom, p value, confidence interval, and often an effect size.
We will cover that process separately in our guide on How to Report Paired t-Test Results in APA Style.
That guide will show you exactly where each value comes from in the SPSS output and how to turn it into a complete APA Results paragraph.
Need Help With a Paired t-Test in SPSS?
The menu steps for a paired t-test are simple, but choosing the correct test, checking the assumptions, understanding the variable order, and interpreting the SPSS output can be more difficult.
If you are working on an assignment, dissertation, thesis, or research project, SPSS-tutors.com provides private one-to-one tutoring.
Your tutor can work through the analysis with you, explain each SPSS table, and help you understand what the result means.
Frequently Asked Questions
How do I run a paired t-test in SPSS?
Go to:
Analyze > Compare Means > Paired-Samples T Test
Select the two related numerical variables, move them into the Paired Variables box as one pair, and click OK.
SPSS will produce descriptive statistics, a paired correlation, and the paired t-test results.
When should I use a paired t-test?
Use a paired t-test when you want to compare two related numerical measurements.
The most common example is measuring the same participants before and after an intervention.
What is the difference between a paired t-test and an independent t-test?
A paired t-test compares related observations, such as pre-test and post-test scores from the same students.
An independent-samples t-test compares two separate groups of participants.
How should paired t-test data be entered in SPSS?
Each participant should normally occupy one row.
Place the first measurement in one column and the second measurement in another column.
For example:
Pre_Test | Post_Test
Does the order of variables matter in a paired t-test?
Yes.
SPSS calculates:
Variable 1 − Variable 2
Changing the order changes the sign of the mean difference and t statistic, although it does not change the two-sided significance conclusion.
Which SPSS table contains the paired t-test result?
Use the Paired Samples Test table.
It contains the mean difference, confidence interval, t statistic, degrees of freedom, and p value.
What does the Paired Samples Correlations table mean?
It shows how strongly the two measurements are related.
Its significance value is not the p value for the difference between the two means.
Use the Paired Samples Test table for the hypothesis test.
What assumptions should I check for a paired t-test?
The variables should be numerical, observations should form meaningful pairs, different pairs should be independent, and the paired difference scores should be approximately normally distributed without serious influential outliers.
Do both variables need to be normally distributed?
Not necessarily.
For the paired t-test, the relevant normality assumption concerns the difference between the paired measurements.
Do I need Levene’s test for a paired t-test?
No.
Levene’s test applies to the equality-of-variance assumption for independent groups. It is not part of the standard paired t-test analysis.
What does a negative t value mean?
A negative t statistic usually means that Variable 1 has a lower mean than Variable 2.
The sign depends on the order in which you entered the variables.
What does the confidence interval mean?
The confidence interval in the Paired Samples Test table estimates the population mean difference between the two paired measurements.
If a two-sided 95% confidence interval does not contain zero, the result will normally be statistically significant at α = .05.
What if my paired t-test is not significant?
A nonsignificant result means the sample did not provide sufficient statistical evidence that the population mean difference differs from zero at the chosen significance level.
It does not prove that the two measurements are exactly equal.
Can SPSS calculate an effect size for a paired t-test?
Recent SPSS versions can provide t-test effect-size estimates.
You can also calculate an effect size based on the mean paired difference and the standard deviation of the difference scores.
How do I report the paired t-test in APA style?
Report the two means and standard deviations, the t statistic, degrees of freedom, p value, and direction of the difference. Confidence intervals and an effect size may also be appropriate.
See our upcoming guide on How to Report Paired t-Test Results in APA Style for the complete reporting process.