
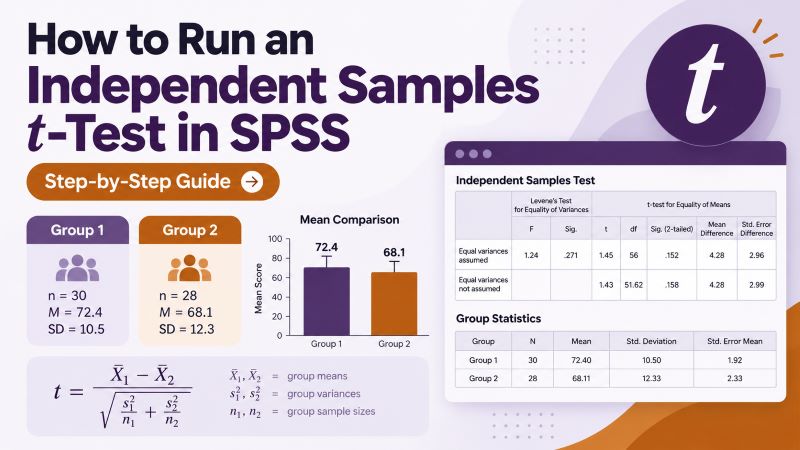
An independent samples t-test compares the mean of a numerical variable between two separate groups. For example, you might compare exam scores between students taught using two different teaching methods or compare stress scores between a treatment group and a control group.
In SPSS, you can run the test by going to Analyze > Compare Means > Independent-Samples T Test, placing your numerical outcome in the Test Variable(s) box, placing your two-group variable in the Grouping Variable box, defining the two groups, and clicking OK.
In newer versions of SPSS, the menu may appear as:
Analyze > Compare Means and Proportions > Independent-Samples T Test
Running the test only takes a few clicks. The more important part is knowing whether the test fits your data and how to interpret the output correctly.
In this guide, you will learn how to set up the data, check the main assumptions, run the test step by step, choose the correct row from the SPSS output, interpret Levene’s test, read the p value and confidence interval, and understand the effect size.
We will use one example throughout so that you can follow the complete process from the research question to the final interpretation.
When Should You Use an Independent Samples t-Test?
Use an independent samples t-test when you want to compare the means of two separate and unrelated groups on one numerical outcome.
For example, you could use it to compare:
- exam scores between two teaching methods;
- blood pressure between treatment and control groups;
- satisfaction scores between full-time and part-time students;
- stress scores between two independent groups;
- reaction times between two experimental conditions where different people take part in each condition.
The test requires two main variables:
A grouping variable
This identifies the two groups.
For example:
1 = Traditional teaching
2 = New teaching method
A numerical test variable
This is the outcome whose mean you want to compare.
For example:
Exam score
The test then asks whether the difference between the two group means provides enough evidence of a difference between the corresponding population means.
Independent vs. Paired vs. One-Sample t-Test
Choosing the correct t-test depends on the study design.
| Research question | Appropriate test |
|---|---|
| Do two separate groups have different mean scores? | Independent samples t-test |
| Did the same participants change from pre-test to post-test? | Paired t-test |
| Does one sample mean differ from a benchmark? | One-sample t-test |
For example, if 30 students receive Method A and a different 32 students receive Method B, the two groups are independent.
If the same students are measured before and after an intervention, the observations are related and you should use a paired t-test instead.
See our How to Run a Paired t-Test in SPSS guide if your data involve the same participants measured twice.
For a comparison with one fixed benchmark, see How to Run a One-Sample t Test in SPSS.
Example Used in This Guide
Suppose a researcher wants to compare exam performance between students taught using two teaching methods.
The groups are:
Group 1 = Traditional teaching
Group 2 = New teaching method
The outcome is:
Exam Score
The sample contains:
| Teaching Method | n | Mean | Standard Deviation |
|---|---|---|---|
| Traditional | 30 | 72.40 | 8.20 |
| New method | 32 | 78.10 | 7.60 |
Students taught using the new method scored an average of 5.70 points higher than those taught using the traditional method.
However, the difference between the sample means alone does not tell us whether the population means differ statistically.
The independent samples t-test answers that question.
For a two-sided test, the hypotheses are:
H₀: μ₁ = μ₂
H₁: μ₁ ≠ μ₂
The null hypothesis states that the two population means are equal.
How Should the Data Be Arranged in SPSS?
For an independent samples t-test, each participant should normally occupy one row.
You need one column for the group and another for the numerical outcome.
For example:
| ID | Teaching_Method | Exam_Score |
|---|---|---|
| 1 | 1 | 71 |
| 2 | 1 | 68 |
| 3 | 2 | 82 |
| 4 | 2 | 79 |
| 5 | 1 | 74 |
In this example:
Teaching_Method
- 1 = Traditional
- 2 = New method
Exam_Score
contains the numerical examination score for each student.
Do not place the scores for Group 1 in one column and the scores for Group 2 in another column when using the standard independent-samples t-test dialog.
The usual SPSS setup uses:
one outcome column + one grouping column
Assumptions of the Independent Samples t-Test
Before running the test, check whether the analysis fits your data.
The Dependent Variable Should Be Numerical
The test variable should represent meaningful numerical measurements.
Examples include:
- test scores;
- age;
- income;
- blood pressure;
- scale scores;
- reaction time.
A variable such as gender, treatment group, or academic program should not be used as the test variable because it represents categories rather than numerical measurements.
The Grouping Variable Should Have Two Groups
Your grouping variable should separate the observations into two groups.
For example:
1 = Treatment
2 = Control
If you have three or more independent groups, a one-way ANOVA may be more appropriate.
The Observations Should Be Independent
Each participant should belong to only one group.
A person in Group 1 should not also contribute a score to Group 2.
If the same participant appears in both conditions, the observations are paired and the independent samples t-test is not appropriate.
Check for Serious Outliers
Extreme observations can strongly affect a mean and standard deviation.
Examine each group for unusual values before running the final test.
Do not automatically delete an outlier. First determine whether it represents a data-entry error, a genuine observation, or something that requires a different analytical approach.
Consider Normality Within Each Group
The outcome should be reasonably well behaved within each group.
The independent samples t-test is fairly robust to moderate departures from normality, especially with reasonable sample sizes, but strong skewness and extreme outliers deserve attention.
You can examine your data using:
Analyze > Descriptive Statistics > Explore
Histograms, Q-Q plots, and descriptive statistics can help you understand the distribution.
Our How to Run Descriptive Statistics in SPSS guide also explains how to inspect numerical variables before conducting inferential tests.
Homogeneity of Variance
The traditional independent samples t-test assumes that the population variances of the two groups are equal.
SPSS can examine this assumption using Levene’s Test for Equality of Variances.
If the assumption does not appear reasonable, SPSS also provides an Equal variances not assumed result, often referred to as Welch’s t-test.
We will look at this carefully when interpreting the output.
How to Run an Independent Samples t-Test in SPSS
Once your variables are set up correctly, follow these steps.
Step 1: Open the Independent-Samples T Test Dialog
From the SPSS menu, go to:
Analyze > Compare Means > Independent-Samples T Test
In newer versions of SPSS, use:
Analyze > Compare Means and Proportions > Independent-Samples T Test
The Independent-Samples T Test dialog box will open.
Step 2: Select the Test Variable
Move the numerical outcome into:
Test Variable(s)
For our example, move:
Exam_Score
into the Test Variable(s) box.
This tells SPSS that exam score is the variable whose group means you want to compare.
Step 3: Select the Grouping Variable
Move:
Teaching_Method
into the:
Grouping Variable
box.
SPSS now knows which variable identifies the two groups.
At this stage, you may see something similar to:
Teaching_Method (? ?)
The question marks mean that SPSS does not yet know which values identify the two groups.
Step 4: Define the Groups
Click:
Define Groups
Enter the codes used in your dataset.
For our example:
Group 1: 1
Group 2: 2
These correspond to:
1 = Traditional
2 = New method
Click Continue.
Always use the actual values stored in your grouping variable.
If you cannot remember the coding, check Variable View or inspect the value labels before continuing.
Step 5: Review the Options
Depending on your SPSS version, you may be able to request:
- a confidence interval;
- effect-size estimates;
- a homogeneity-of-variance test.
A 95% confidence interval is commonly used.
Recent versions of SPSS can also calculate effect-size estimates automatically, so select that option when available.
Step 6: Click OK
Click:
OK
SPSS will run the test and send the results to the Output Viewer.
The most important output will normally include:
- Group Statistics
- Independent Samples Test
- Independent Samples Effect Sizes, if requested
Depending on your SPSS version and settings, Levene’s test may appear inside the Independent Samples Test table or in a separate homogeneity table.
How to Interpret the Group Statistics Table
Start with the Group Statistics table.
For our example, suppose SPSS reports:
| Teaching Method | N | Mean | Std. Deviation | Std. Error Mean |
|---|---|---|---|---|
| Traditional | 30 | 72.40 | 8.20 | 1.50 |
| New method | 32 | 78.10 | 7.60 | 1.34 |
This table gives you the descriptive statistics for each group.
Sample Size
The traditional group has:
n = 30
The new-method group has:
n = 32
Check these values against the sample sizes you expected.
If SPSS shows fewer cases than expected, look for missing data, filters, or coding problems.
Means
The traditional group has:
M = 72.40
The new-method group has:
M = 78.10
The observed difference is:
72.40 − 78.10 = −5.70
Students using the new teaching method therefore scored 5.70 points higher on average.
This is a descriptive difference.
You still need the Independent Samples Test table to determine whether the difference is statistically significant.
Standard Deviations
The standard deviations are:
Traditional: SD = 8.20
New method: SD = 7.60
These values describe the spread of exam scores within each group.
Understanding the Independent Samples Test Table
The Independent Samples Test table is the main table for the hypothesis test.
In many SPSS versions, you will see two rows:
Equal variances assumed
and:
Equal variances not assumed
This is one of the parts that causes the most confusion for beginners.
You should not report both rows.
The appropriate row depends on how you handle the variance assumption.
How to Interpret Levene’s Test
Levene’s test examines whether there is evidence that the variances differ between the two groups.
Suppose SPSS reports:
Levene’s F = 0.34, p = .56
Because:
.56 > .05
Levene’s test is not statistically significant.
This means the analysis does not provide evidence of a substantial variance difference between the groups.
Under the traditional SPSS decision rule, you would use:
Equal variances assumed
If instead SPSS reported:
p = .012
then:
.012 < .05
Levene’s test would indicate evidence against equal variances.
You would then normally use:
Equal variances not assumed
This second row uses an unequal-variance version of the test, commonly known as Welch’s t-test.
A useful shortcut is:
| Levene’s p value | SPSS row commonly used |
|---|---|
| p > .05 | Equal variances assumed |
| p ≤ .05 | Equal variances not assumed |
Do not interpret Levene’s test as your main hypothesis test.
Its p value only helps you assess the variance assumption.
The t-test p value answers the actual question about whether the two means differ.
Which Row Should You Use?
For our example, suppose Levene’s test gives:
p = .56
We therefore use:
Equal variances assumed
Imagine SPSS reports the following in that row:
| Statistic | Result |
|---|---|
| t | −2.84 |
| df | 60 |
| Two-sided p | .006 |
| Mean Difference | −5.70 |
| 95% CI | [−9.71, −1.69] |
These are the values we use to interpret the test.
If Levene’s test had indicated unequal variances, we would instead read the statistics from the Equal variances not assumed row.
How to Interpret the t Statistic
SPSS reports:
t = −2.84
The sign tells you the direction of the difference based on how SPSS subtracts the group means.
We defined:
Group 1 = Traditional
Group 2 = New method
SPSS therefore calculates:
Group 1 mean − Group 2 mean
which gives:
72.40 − 78.10 = −5.70
Because Group 1 has the lower mean, the t statistic is also negative.
A negative t statistic does not mean that the result is wrong.
It only reflects the direction of the subtraction.
Degrees of Freedom
For the equal-variances result, SPSS reports:
df = 60
With the traditional pooled-variance independent samples t-test:
df = n₁ + n₂ − 2
Using our example:
30 + 32 − 2 = 60
If you use the Equal variances not assumed row, SPSS may report a non-integer or adjusted degrees-of-freedom value.
That is normal.
Use the value SPSS provides.
How to Interpret the p Value
For our example:
p = .006
Using α = .05:
.006 < .05
The result is statistically significant.
We therefore reject the null hypothesis of equal population means.
The data provide evidence that mean exam scores differ between students taught using the traditional method and those taught using the new method.
Now use the group means to determine the direction.
The new-method group has the higher mean:
78.10 vs. 72.40
Therefore, students taught using the new method scored significantly higher, on average, than those taught using the traditional method.
Do not stop at:
“There was a significant difference.”
Tell the reader which group had the higher mean.
One-Sided vs. Two-Sided p Values
Recent versions of SPSS may display:
One-Sided p
and:
Two-Sided p
Use the p value that matches the hypothesis specified before you analyzed the data.
If your research question asks:
Do the two teaching methods produce different mean exam scores?
the hypothesis allows either group to score higher.
Use the two-sided p value.
If you had a justified directional hypothesis such as:
Students taught using the new method will score higher than students taught using the traditional method,
a one-sided test may be appropriate if you specified that direction before examining the results.
Do not choose the one-sided p value after seeing which group scored higher.
Older SPSS versions may label the two-sided result:
Sig. (2-tailed)
What Does Mean Difference Mean?
SPSS reports:
Mean Difference = −5.70
This is calculated as:
Group 1 mean − Group 2 mean
For our example:
72.40 − 78.10 = −5.70
The negative sign means Group 1 scored lower than Group 2.
You can explain the result more naturally as:
Students taught using the new method scored 5.70 points higher on average than students taught using the traditional method.
The size of the difference is the same.
The sign only depends on the order in which the groups were defined.
How to Interpret the 95% Confidence Interval
Suppose SPSS reports:
95% CI [−9.71, −1.69]
This interval refers to the population mean difference between Group 1 and Group 2.
Because SPSS calculated:
Traditional − New method
the entire interval is negative.
In practical terms, the traditional group is estimated to score between approximately 1.69 and 9.71 points lower than the new-method group.
Another important feature is that the confidence interval does not include zero.
That agrees with the significant two-sided t-test result.
If an interval looked like:
[−4.20, 2.10]
it would contain zero.
For a conventional two-sided test at α = .05, that would normally correspond to a nonsignificant result.
Effect Size for an Independent Samples t-Test
Statistical significance tells you whether the data provide evidence of a difference.
It does not tell you how large the difference is.
An effect size helps answer that question.
Recent SPSS versions can estimate t-test effect sizes automatically.
One commonly reported measure is Cohen’s d.
For our example, the standardized difference is approximately:
|d| = 0.72
The sign depends on the direction of subtraction, so researchers often focus on the magnitude when discussing effect size.
Common reference values are:
| Cohen’s d | General interpretation |
|---|---|
| 0.20 | Small |
| 0.50 | Medium |
| 0.80 | Large |
Using those rough guidelines, an effect size of approximately 0.72 represents a moderate-to-large difference.
Treat these values as general reference points rather than strict rules.
The practical importance of a difference depends on the context.
Complete Interpretation of the Example
Our SPSS analysis produced the following results:
| Statistic | Traditional | New Method |
|---|---|---|
| n | 30 | 32 |
| Mean | 72.40 | 78.10 |
| Standard deviation | 8.20 | 7.60 |
The inferential results were:
| Statistic | Result |
|---|---|
| Levene’s p | .56 |
| t | −2.84 |
| df | 60 |
| Two-sided p | .006 |
| Mean difference | −5.70 |
| 95% CI | [−9.71, −1.69] |
| Cohen’s d | approximately 0.72 |
Levene’s test was not significant, so the equal-variances result was used.
The new teaching method produced a higher mean exam score than the traditional method.
The independent samples t-test was statistically significant:
t(60) = −2.84, p = .006
The 95% confidence interval did not include zero, which supports the same conclusion.
The effect size indicates a moderate-to-large standardized difference between the groups.
What if Levene’s Test Is Significant?
Suppose Levene’s test gives:
p = .018
This suggests that the equal-variance assumption may not be appropriate.
In the standard SPSS output, move to:
Equal variances not assumed
and interpret the t, degrees of freedom, p value, mean difference, and confidence interval from that row.
Do not use:
Equal variances assumed
simply because it appears first.
The unequal-variance result adjusts the standard error and degrees of freedom to account for the different variances.
This becomes particularly important when group sizes and variances differ substantially.
What if the Independent Samples t-Test Is Not Significant?
Suppose another study produces:
Group 1: M = 72.40, SD = 8.20
Group 2: M = 74.10, SD = 7.90
and:
t(60) = −0.83, p = .410
Because:
.410 > .05
the result is not statistically significant.
You would fail to reject the null hypothesis.
A suitable interpretation would be:
The analysis did not provide sufficient evidence that the population mean exam scores differed between the two teaching methods.
Do not write:
The two groups had the same mean.
The sample means clearly differ numerically.
The test simply did not provide sufficient statistical evidence of a population difference.
What Happens if the Group Sizes Are Unequal?
The two groups do not need to contain exactly the same number of cases.
For example:
Group 1: n = 25
Group 2: n = 40
can still be analyzed with an independent samples t-test.
However, large differences in group sizes become more important when the group variances also differ.
In those situations, pay close attention to the unequal-variance result.
Always inspect the Group Statistics table to confirm how many valid cases SPSS used from each group.
What Happens if Some Values Are Missing?
SPSS can only include cases that have the necessary values for the variables in the test.
If a participant has a missing exam score or a missing group code, that case will not contribute to the comparison.
For that reason, compare the N values in the Group Statistics table with the numbers you expected.
An unexpected reduction in sample size may indicate:
- missing values;
- an active filter;
- incorrect coding;
- selected cases;
- another data-management issue.
How to Run an Independent Samples t-Test Using SPSS Syntax
You can also run the test using syntax.
Suppose:
Grouping variable = Teaching_Method
Group 1 = 1
Group 2 = 2
Outcome = Exam_Score
You can use:
T-TEST GROUPS=Teaching_Method(1 2)
  /VARIABLES=Exam_Score
  /CRITERIA=CI(.95).
Recent versions of SPSS can also request effect sizes through syntax.
Syntax becomes useful when you need to repeat analyses or keep a record of exactly what you did.
This is particularly helpful for dissertations, theses, and larger research projects.
Common Mistakes When Running an Independent Samples t-Test
Using the test for the same participants measured twice.
Use a paired t-test for repeated measurements from the same people.
Putting the two groups into separate outcome columns.
The standard SPSS setup uses one numerical outcome column and one grouping variable.
Forgetting to define the group codes.
SPSS needs to know which two values identify the groups.
Using a categorical variable as the test variable.
The dependent variable should be numerical.
Interpreting Levene’s p value as the t-test result.
Levene’s test only addresses the variance assumption.
Reporting both SPSS rows.
Use the row that fits the variance decision.
Automatically using the first row.
Check the variance result before interpreting the test.
Looking only at the p value.
Also examine the group means, mean difference, confidence interval, and effect size.
Assuming a negative t statistic means something went wrong.
The sign reflects the order in which SPSS subtracts the group means.
Ignoring missing cases.
Check the N for each group.
Saying a nonsignificant result proves the groups are equal.
A nonsignificant test does not establish exact equality.
Using significance to make a causal claim.
A significant difference does not prove that group membership caused the outcome unless the research design supports that conclusion.
Independent Samples t-Test SPSS Checklist
Before you finish the analysis, check that:
- the dependent variable is numerical;
- the grouping variable has two relevant groups;
- the observations are independent;
- each participant belongs to only one group;
- you checked for serious outliers;
- you considered the distribution within each group;
- the group codes are defined correctly;
- the sample sizes match what you expected;
- you reviewed the Group Statistics table;
- you checked the variance assumption;
- you selected the correct SPSS row;
- you identified the correct p value;
- you compared the two group means;
- you interpreted the sign of the mean difference correctly;
- you checked whether the confidence interval includes zero;
- you considered an effect size where appropriate.
How Do You Report an Independent Samples t-Test in APA Style?
Once you have run and interpreted the analysis, the next step is to report the result clearly.
A complete APA-style report will usually include:
- the means and standard deviations for both groups;
- the t statistic;
- degrees of freedom;
- the p value;
- the direction of the difference;
- the confidence interval where appropriate;
- an effect size such as Cohen’s d.
We will cover this separately in our guide on How to Report Independent Samples t-Test Results in APA Style.
That guide will show you exactly which values to take from the SPSS output and how to turn them into a publication-ready Results paragraph.
Need Help With an Independent Samples t-Test in SPSS?
The SPSS steps are fairly simple once the data are prepared correctly. The difficult parts are often choosing the correct test, checking the assumptions, deciding which output row to use, and explaining what the result means.
If you are working on an assignment, dissertation, thesis, or research project, SPSS-tutors.com provides private one-to-one tutoring.
Your tutor can work through the analysis with you, explain the SPSS output, and help you understand why each statistical decision matters.
Frequently Asked Questions
How do I run an independent samples t-test in SPSS?
Go to:
Analyze > Compare Means > Independent-Samples T Test
or, in newer versions:
Analyze > Compare Means and Proportions > Independent-Samples T Test
Move the numerical outcome into Test Variable(s), move the two-group variable into Grouping Variable, define the two group codes, and click OK.
What variables do I need for an independent samples t-test?
You need one numerical dependent variable and one grouping variable with two independent groups.
For example:
Outcome: Exam score
Group: Teaching method, coded 1 and 2
How should the data be entered in SPSS?
Each participant should usually occupy one row.
Use one column for the outcome and one column for group membership.
What does Levene’s test tell me?
Levene’s test examines whether the data provide evidence that the two population variances differ.
In the traditional SPSS interpretation, a nonsignificant Levene result usually leads you to the Equal variances assumed row, while a significant result leads you to the Equal variances not assumed row.
Which row do I use in the Independent Samples Test table?
If the equal-variance assumption is reasonable, use:
Equal variances assumed
If the variances appear unequal, use:
Equal variances not assumed
Do not report both rows.
What does Equal variances not assumed mean?
This row uses an unequal-variance version of the independent samples t-test, commonly called Welch’s t-test.
It adjusts the standard error and degrees of freedom when the group variances are not assumed to be equal.
What does a negative t value mean?
A negative t statistic usually means the mean of Group 1 is lower than the mean of Group 2.
The sign depends on the order in which you define the groups.
Which p value tells me whether the groups differ?
Use the p value from the t-test result, not the p value from Levene’s test.
For a nondirectional hypothesis, use the two-sided p value.
What does Mean Difference mean in SPSS?
SPSS subtracts:
Group 1 mean − Group 2 mean
A negative value means Group 1 has a lower mean.
A positive value means Group 1 has a higher mean.
What does the 95% confidence interval mean?
The interval estimates the population difference between the two group means.
If a two-sided 95% confidence interval does not contain zero, the t-test will normally be significant at α = .05.
Do the two groups need equal sample sizes?
No.
An independent samples t-test can compare groups with different sample sizes.
However, unequal group sizes become more important when the group variances also differ.
Does SPSS calculate Cohen’s d?
Recent versions of SPSS can estimate t-test effect sizes.
If available, select the effect-size option when running the analysis.
What if Levene’s test is significant?
Use the Equal variances not assumed result and interpret the t statistic, degrees of freedom, p value, and confidence interval from that row.
What if the t-test is not significant?
A nonsignificant result means the data did not provide sufficient evidence of a population mean difference at the chosen significance level.
It does not prove that the two population means are exactly equal.
What is the difference between an independent and paired t-test?
An independent samples t-test compares two separate groups.
A paired t-test compares related measurements, such as pre-test and post-test scores from the same participants.
How do I report an independent samples t-test in APA style?
Report the group means and standard deviations, t-statistic, degrees of freedom, p-value, and direction of the difference. A confidence interval and effect size may also be appropriate.
See our upcoming How to Report Independent Samples t-Test Results in APA Style guide for the complete reporting process.